Reordering The 4th Wave Count
Without upside follow through thus far, I am now forced to re-order the wave counts I have been tracking. I know I have held onto the potential for the market to reach the 4882SPX region since we hit the 4270SPX low in wave 4 of [3], but I think I have to accept that we came up a bit short.
Not only have we potentially come up short, the other reason I have been reticent in accepting the high as place as the completion of wave [3] is that it would force me to accept a non-overlapping ending diagonal as wave 5 of [3]. And, not only was it a non-overlapping ending diagonal, but it was one wherein the standard proportions were not seen within the sub-wave structures. And, furthermore, another problem with it is that when the diagonal ended, it should have reversed quite strongly well below the 4570SPX region.
So, what I am saying is that I think I am being forced to accept a labeling of this pattern which is far from ideal and exceptionally rare. Yet, I may have no choice at this point in time. And, while I will still keep some eye on a potential higher high, I think the probabilities have likely dropped enough that I have to review my view.
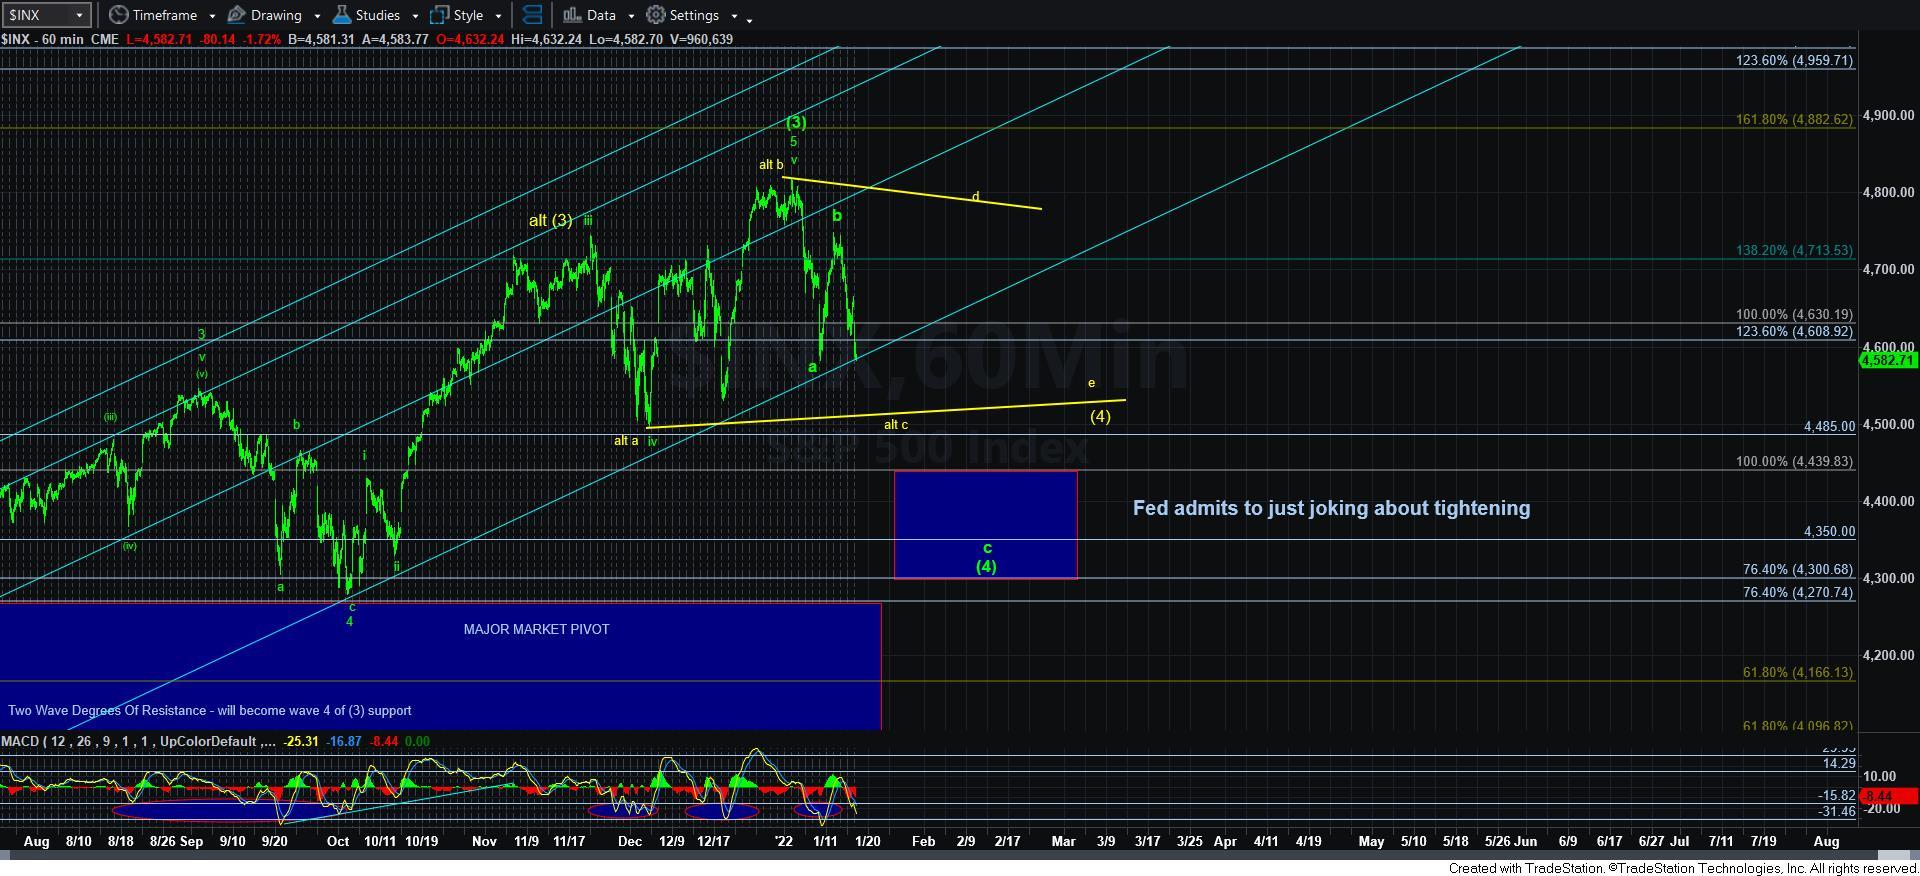
Therefore, my current primary count is a form of what I was presenting before in yellow, but not exactly the same structure. Rather, I think this decline is wave 1 in the c-wave, which should give us a wave 2 bounce – again, ideally. Unfortunately, the structure with which we have been dealing with on the smaller degree since we bottomed in wave 4 at the 4270SPX region has been very complex and unusual, which is why the smaller degree structure has been clouded.
My alternative count is now a bigger triangle, and the support for this triangle would be the 4510SPX region for the c-wave within that triangle. Clearly, a break of 4510SPX would make this potential even less likely than I think it may be now. But, if we do drop down towards that region and begin another sizeable rally, then we will move into the triangle count.
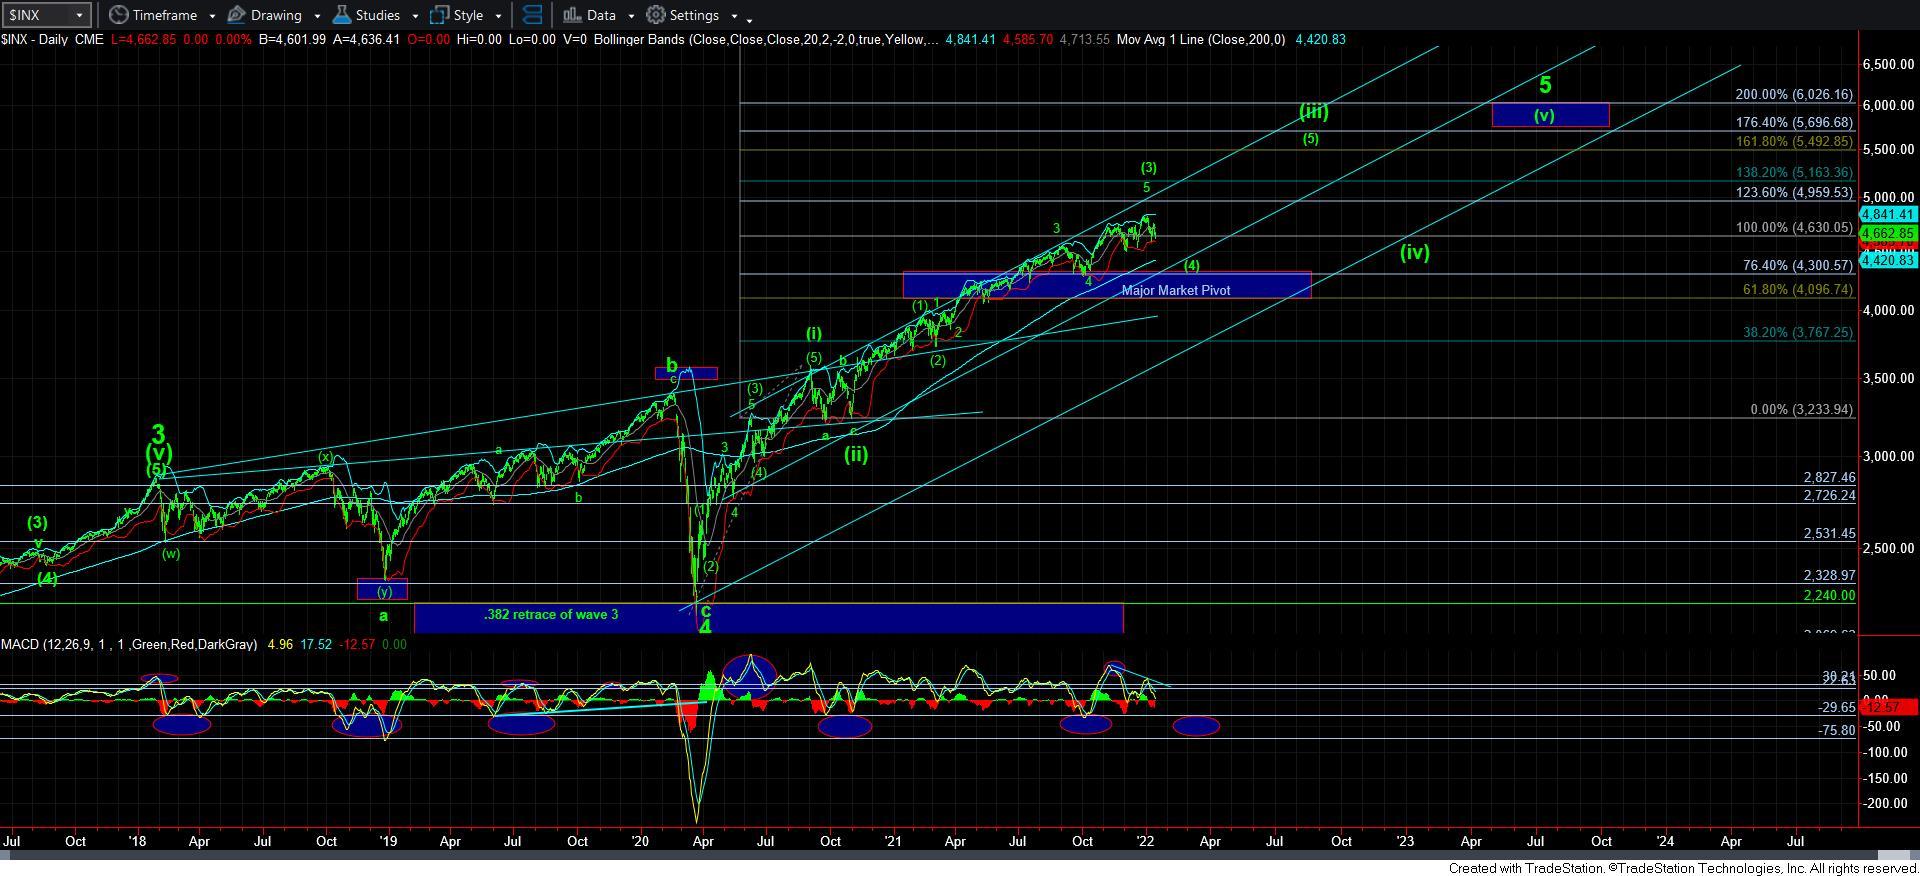
Again, the structure of the market in this region has been less than ideal from a number of perspectives. So, I think it would be much more valuable for most of our members to focus on the bigger picture at this time. If you look at the daily chart, it is quite clear that we have been meandering in this region now for months. And, during that time, I have been questioning where wave [3] ends and wave [4] begins. I cannot say that I am 100% clear on that at this time still, but I think it may be best to now focus on the next buying opportunity in the market in the weeks and months to come.
In an ideal world, I would still like to see the market drop down to at least the 4400SPX region, and have the MACD on the daily chart re-set back down into the support region outlined by the ellipse on the daily chart. That would likely set us up for the next major rally phase I expect to the 5500SPX region.
So, when we consider how many stocks within the market have been in a pullback for much of 2021, and may become our next leaders in the wave [5] of [iii], we need to focus on the likelihood that the market has 900 points overhead at this point in time, with the potential for as much as another 200-300 points below us in wave [4]. And, the closer we move towards the 4400SPX region, the large the skew and potential grows for the next bullish phase in the market which I still expect to begin over the coming months.
In summary, our plan last week was to raise cash when the market rallied to our target this past week within 1.5% of the all-time high in order to prepare for the 4th wave pullback. I plan on deploying that cash in the coming weeks depending upon how the market resolves around the 4510SPX region.