Reasonable Expectations - Market Analysis for Dec 16th, 2019
The market has now moved up into the next resistance region that we were pointing towards in our recent analysis. Today, we have struck moved into the next resistance of 2193-3207SPX. And, the question is if this is enough to complete the 5-wave structure off the October lows?
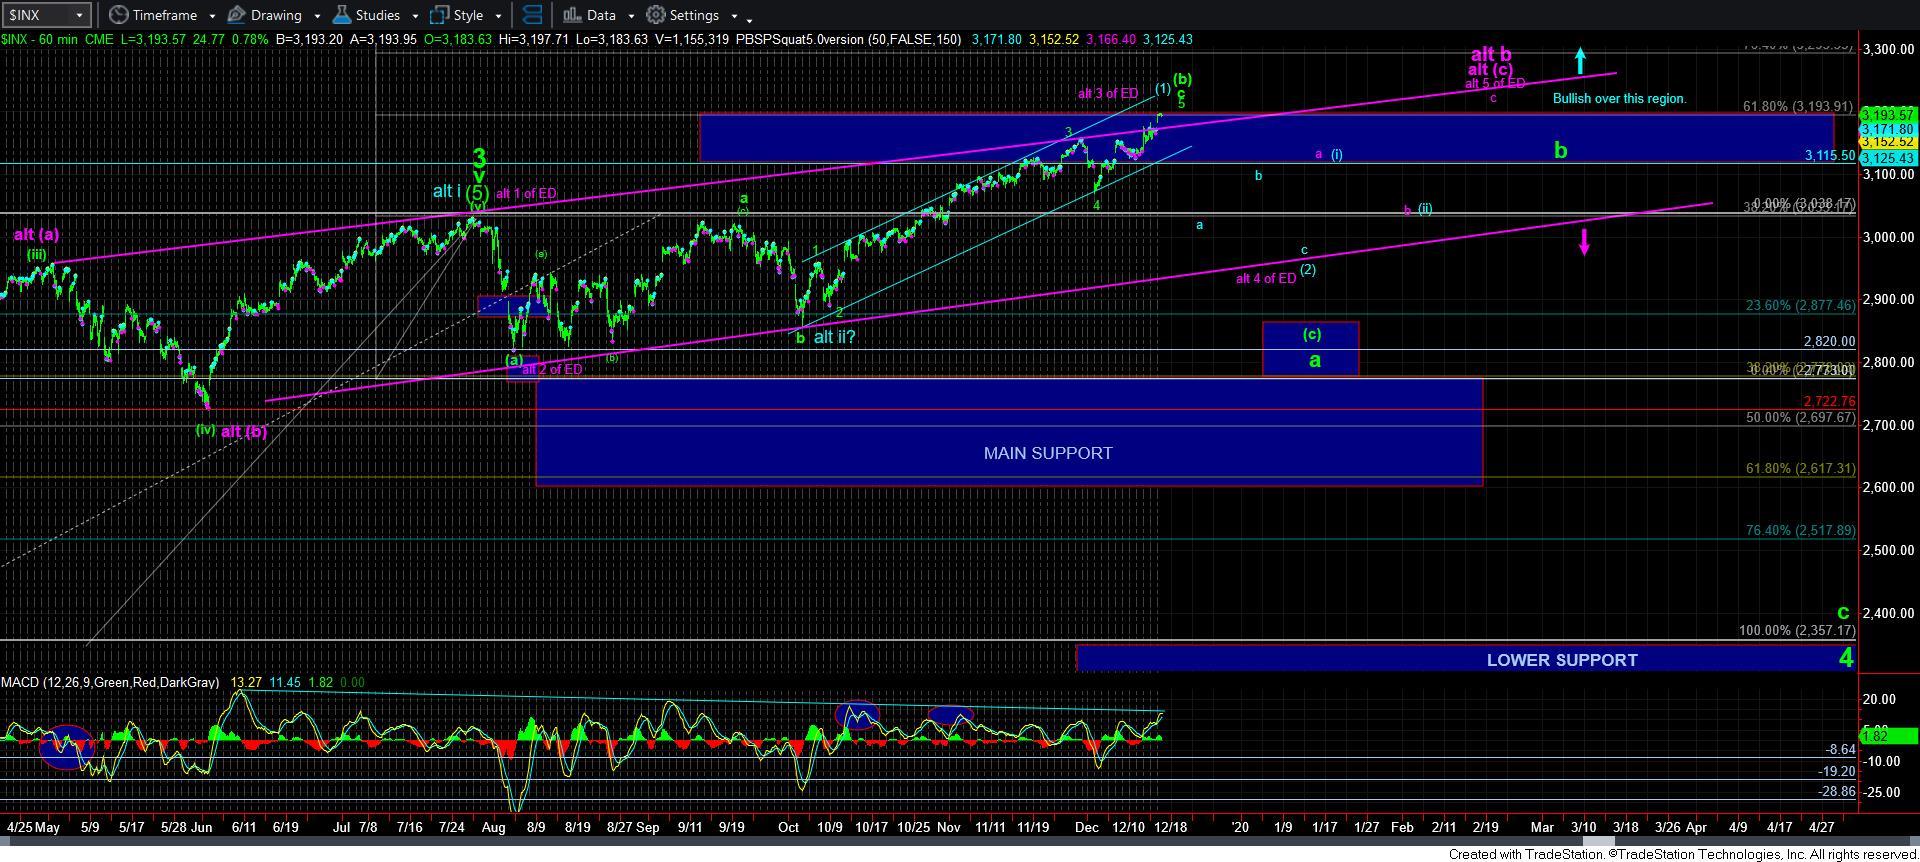
When I apply my analysis to the equity markets, I view it from multiple wave degrees as to impute the most reasonable wave count. And, with us now moving to the upper end of the bullish resistance box, I have to note that the purple count has become less and less of a probability to me. While I still cannot dismiss it just yet, as it will likely take us into the end of the first quarter to do so, moving up towards the top of the box now leads me to view the most probable counts as either the green count or the blue count.
Now, even though we have come up this high, I still have to maintain a reasonable expectation of a larger degree pullback at a minimum. You see, in order to attain our longer term targets of 3800+, the market likely should still see at least a wave [2] pullback, as shown in blue. Yet, if the next decline take shape as a clear 5-wave impulsive decline, I am going to have to maintain the green count as my primary perspective until it is invalidated. However, if the market drops in a clearly corrective decline, I will likely adopt the blue count as my primary expectation.
Yet, the question is when will this rally off the October low complete? There is no doubt that this has been a very tough question to answer. When we consider that standard impulsive structures target the 2.00 extension of waves 1 and 2 off the lows, and we are now at the 3.00 extension of the 1-2 structure off the October low, we are clearly quite stretched in this 5-wave rally off the October low.
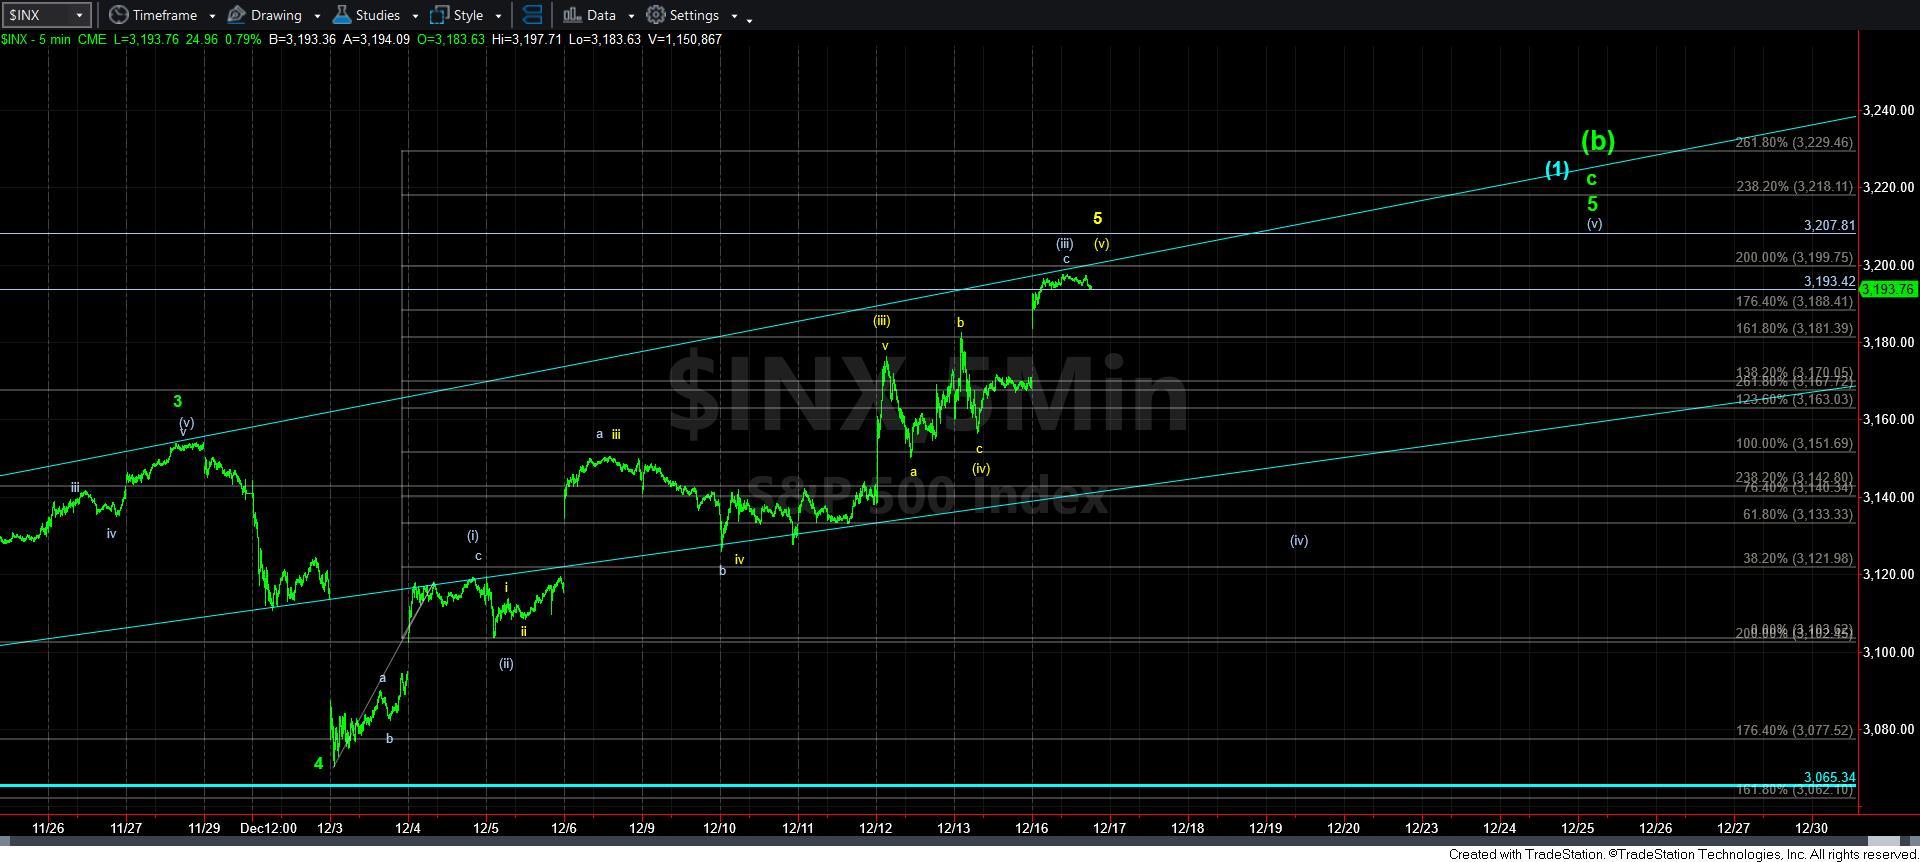
Within that rally off the October low, I am currently viewing this as the 5th wave of that rally, which is support across many charts I track. The more micro question is where this 5th wave also tops out?
Today, I provided an alert which outlines how this rally may already be completed - as shown in yellow on the attached 5-minute SPX chart. As you can see, we have an almost perfect Fibonacci Pinball structure just about striking the 2.00 extension off the early December low. While the Elliott Wave structure is less than ideal, I have to at least point out that we have just about fulfilled a Fibonacci Pinball 5-wave structure.
Currently, micro support is in the 2181-85SPX region, with 3152SPX below that. But, in the bigger picture, the market is going to have to break down below 3115SPX, with follow through below the all-important 3070SPX level to indicate that the next larger degree pullback is in progress. And, the manner in which we break below 3070SPX will tell us if we have to follow the green count or the blue count.
Lastly, I want to address a question I have gotten quite a bit of late. Many of you are wondering how high I can even consider this as a b-wave? Well, based upon our Fibonacci Pinball structures, I have seen expanded b-waves taking us up towards as high as the .618 extension within a rally structure. And, we are there right now. Moreover, we also have a standard target for a wave [1] of iii which targets that same region. And, for this reason, I have noted many times that the manner in which we decline from this region will be of utmost importance in guiding us as to which is the more higher probability count as we look towards 2020.