Rally Off Support – But, Heading To DANGER ZONE
With the market holding support, we seem to have rallied on bad news this morning. But, the question is the nature of the rally?
If you read my 2nd update yesterday afternoon, you would now know that the only 5-wave pattern to the upside for wave v of 1 will take shape as a leading diagonal. Whereas I warned you to reduce risk as we were hovering just below the recent high struck at 4637SPX because I had no guarantee we would get a 5th wave for wave 1, I will say that I am even less confident of it if I have to rely on a leading diagonal for that potential. But, the pattern is still very much alive, and it will remain my primary count for now.
But, the only thing that can confirm it at this point is if we see an a high over 4637SPX. Yet, that higher high will likely take shape as an [a]-[b]-[c] structure if this is indeed going to be a leading diagonal. As I noted in an alert this morning:
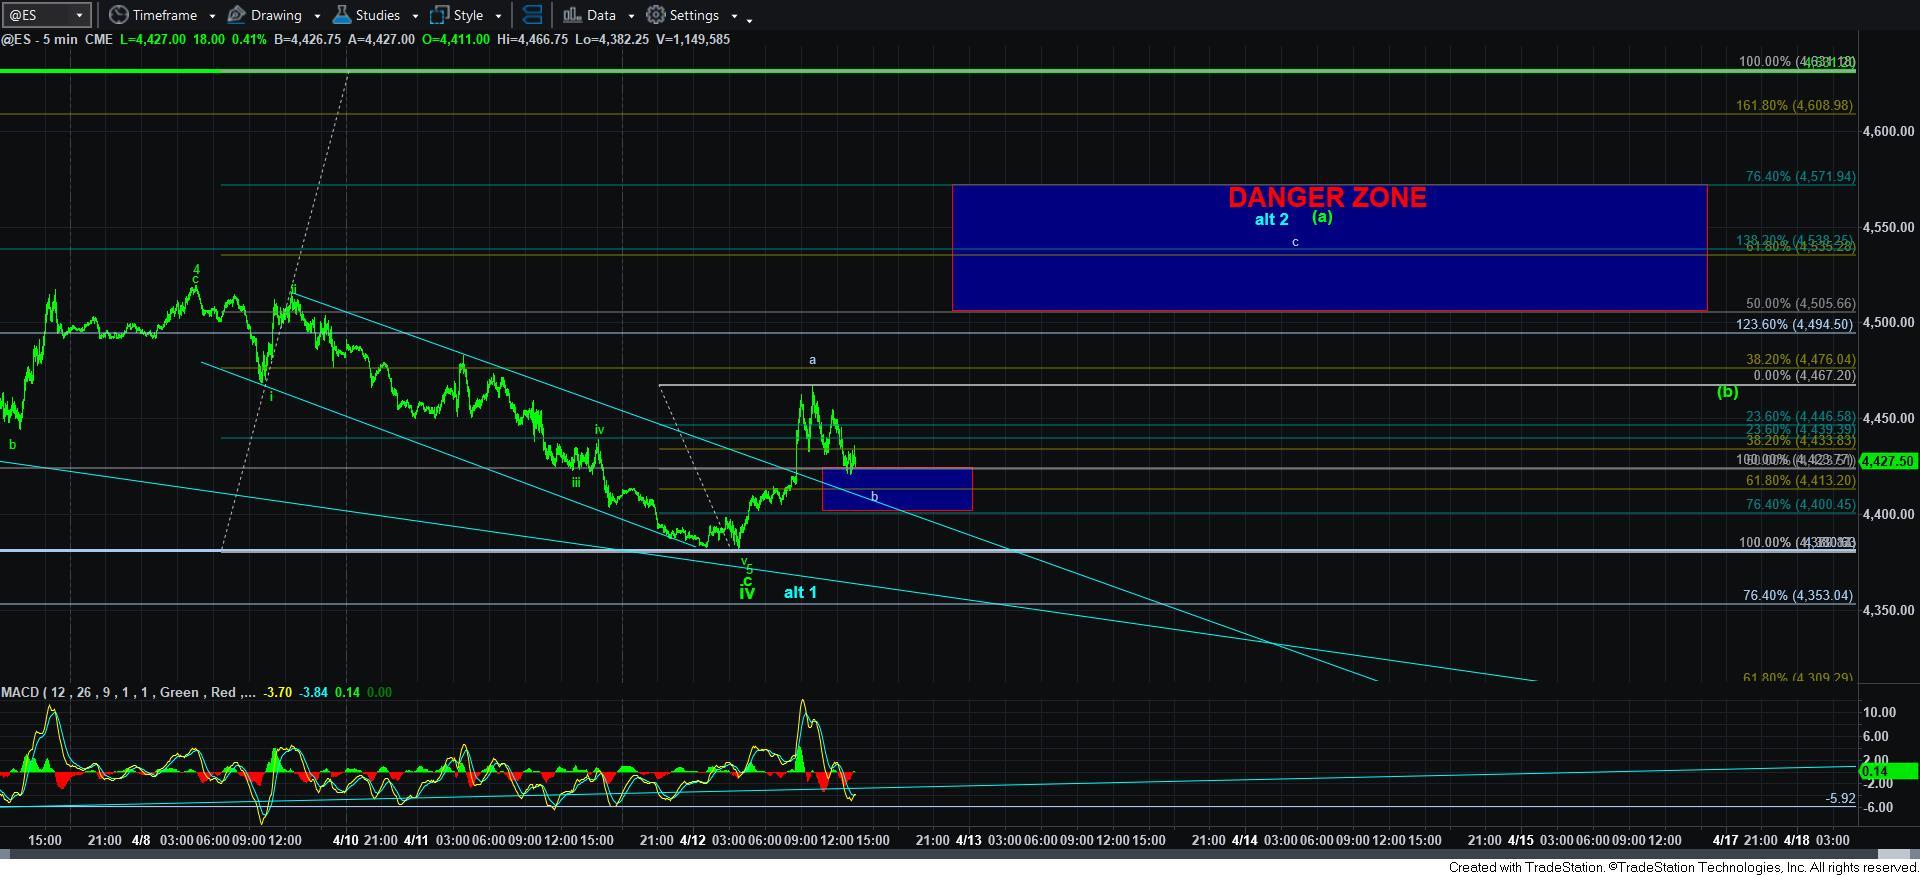
“Well, this is when it is going to get tricky. Due to the overlap in what would have otherwise been an ideal Fibonacci Pinball pattern, we now have to track both counts at the same time, as they will be initially taking the same likely path. I plan to hedge my long positions in the DANGER ZONE.”
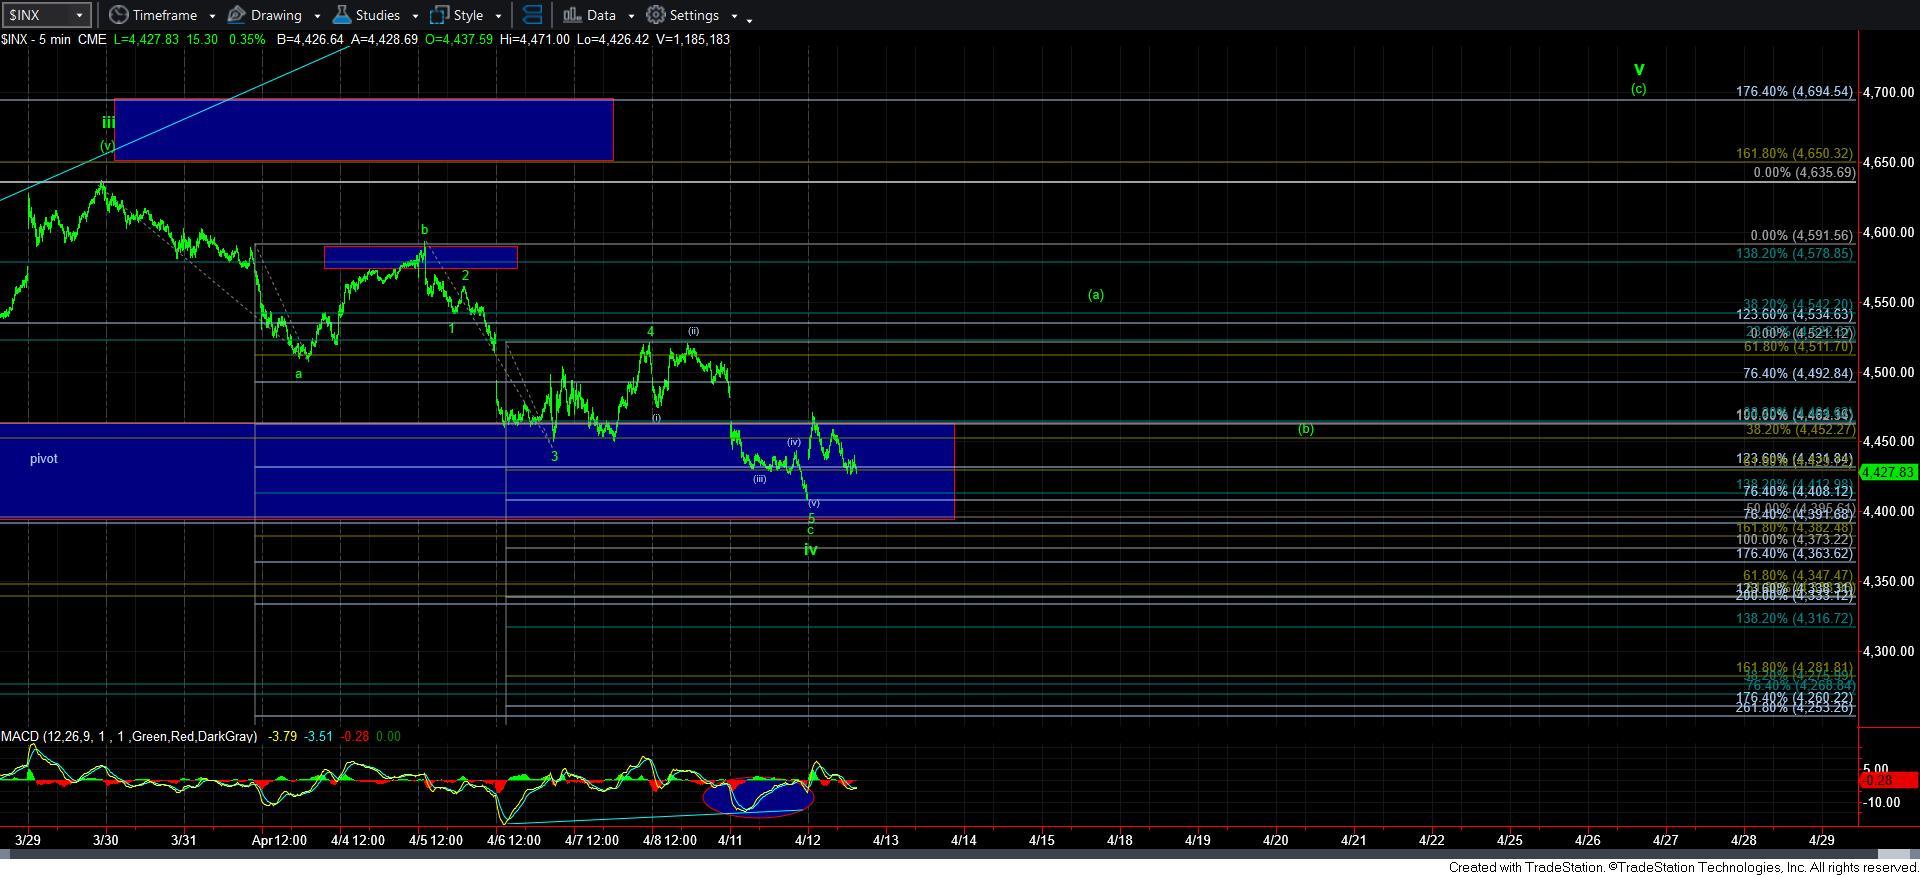
You see, the wave v of wave 1 of a leading diagonal will take an [a]-[b]-[c] structure, and the [a]-wave will also take an a-b-c structure. Moreover, in the event that the blue count takes shape, this would be a wave 2 rally, which also takes shape as an a-b-c structure. So, moving up towards our DANGER ZONE box overhead will likely take shape as an a-b-c structure, and it can represent the [a] wave of wave v of 1, or the same structure can represent the wave 2 in blue.
The only way we will be able to distinguish between the two is based upon how the market drops from that resistance region. The blue count will provide us with an impulsive drop for wave i of wave 3, whereas the green count will provide us with a corrective pullback in the [b] wave of wave v of 1.
To put it more simply, as long as we hold 4400ES, I think we rally up to the DANGER ZONE, which represents the .500-.764 retracement of the drop off the 4637SPX high. Should we then break down below 4385SPX after this upside move, then that opens the trap door down to 4000.
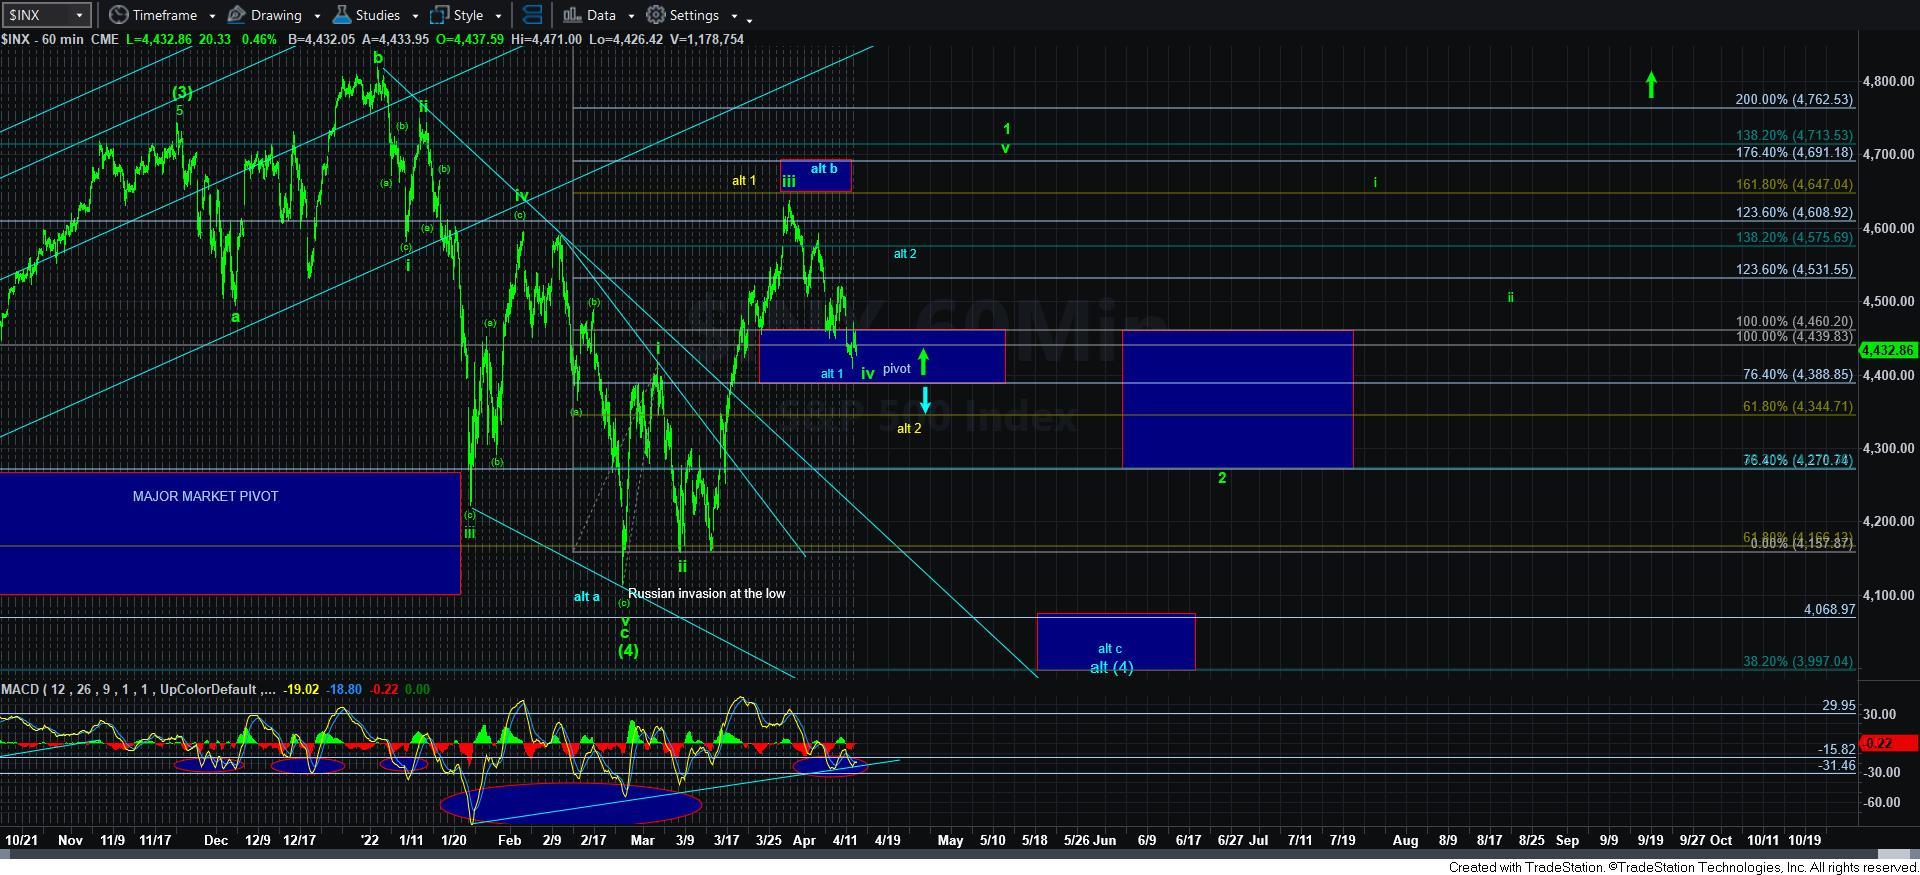
Now, due to the overlap we experienced yesterday, there are other bullish options, such as the entire wave [5] of [iii] taking shape as an ending diagonal, with wave 1 having completed at 4637SPX, but I do not have any strong proof for such a pattern right now. While I have it noted in yellow on my 60-minute chart, I can only really consider this potential if we get a higher high over 4637SPX. At that time, it will be an alternative I track. But, I wanted to at least point it out to you now so you are not surprised by it should we get a higher high. Unfortunately, the overlap causes me to track other options now.
In the meantime, the main point I am trying to make here is that risks have risen further due to the overlap yesterday. We now have the potential for a leading diagonal for wave v of 1 in the green bullish count, whereas the blue alternative relies on a leading diagonal to the downside. So, I cannot say that either of these patterns are giving me strong cues at the moment.
Therefore, should we rally up to the DANGER ZONE, I intend on hedging my own long position until the market is able to prove itself with a move over 4637SPX. I am choosing to do this from a risk management standpoint, and not necessarily because I don’t think the v of 1 can still develop. It is just that neither pattern is providing me with a strong cue, and I just want to reduce risk and get some account protection until the market proves itself.