REFLECTION ON THIS WEEK
After having some time to decompress after the close, I wanted to reflect on the action this week, as we clearly experienced unusual action this week.
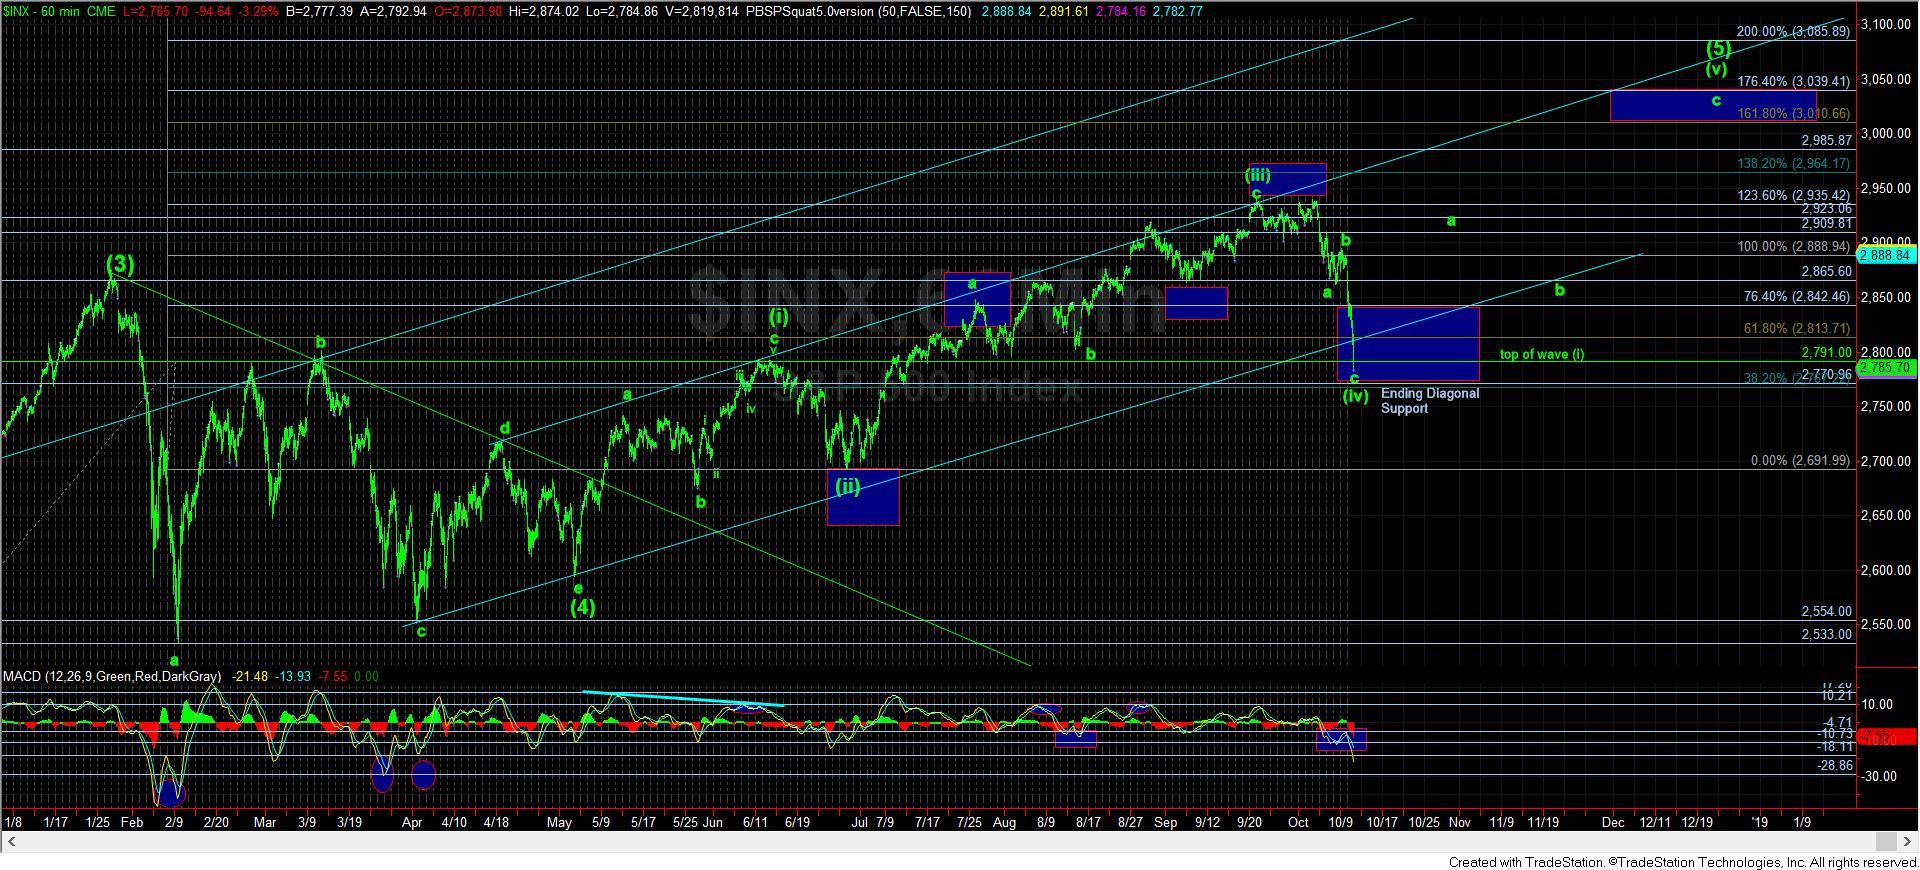
The first thing I noted was that the b-wave was exceptionally unusual in that it only retraced .382 of the a-wave. The great majority of b-waves will target the .618-.764 retracements. Yet, when the market broke below 2783ES, that was our clear warning that downside in the c-wave is likely taking hold.
I also went back and looked at my updates over the weekend and earlier this week, and it was rather clear that my ideal expectation was to see a spike and reversal of the 2791SPX region, as that is what happens in the great majority of the time in ending diagonals:
Yesterday: “In the bigger perspective, I still think we are within wave (iv), with resistance overhead between 2910-24SPX. As long as we remain below that resistance, I am looking for a drop to AT LEAST the 2840SPX region, with potential we can see as deep as the 2791SPX region, as that is the top of wave (i), which is usually overlapped within a 4th wave in an ending diagonal.”
Monday: “In fact, as I noted over the weekend, we normally see 4th waves in a diagonal overlap with the 1st wave. And, since the top of the 1st wave of this diagonal is in the 2791 region, I would almost want to see a spike and reversal of that level to complete this 4th wave, and kick off the 5th wave. But, in a minority of circumstances, we can see an ending diagonal without overlap in the 4th wave. . . Ultimately, as long as we hold over 2770SPX, my expectation is to still see a rally over 3000 to complete this final 5th wave in the 3rd wave off the 2009 lows.”
Weekend: “Normally, I would expect us to drop down to the trend channel presented on the 60-minute chart in a 4th wave. However, remember that MOST ending diagonals see wave (iv) overlap into wave (i) territory. Wave (i) completed at 2791SPX. So, ideally, we should see a drop just below that level if this is going to turn into a standard ending diagonal.
But, this is where trying to trade for the last segment of an ending diagonal gets very tricky. Even though the ideal target is 3011-3040SPX for this ending diagonal, sometimes they do not reach their ultimate conclusion. Moreover, sometimes they even top where one would expect only wave (iii) to top, and many times they even see a strong spike through their standard targets. In other words, when dealing with ending diagonals, you have to understand you are in a treacherous market environment which provides significant volatility in both directions.
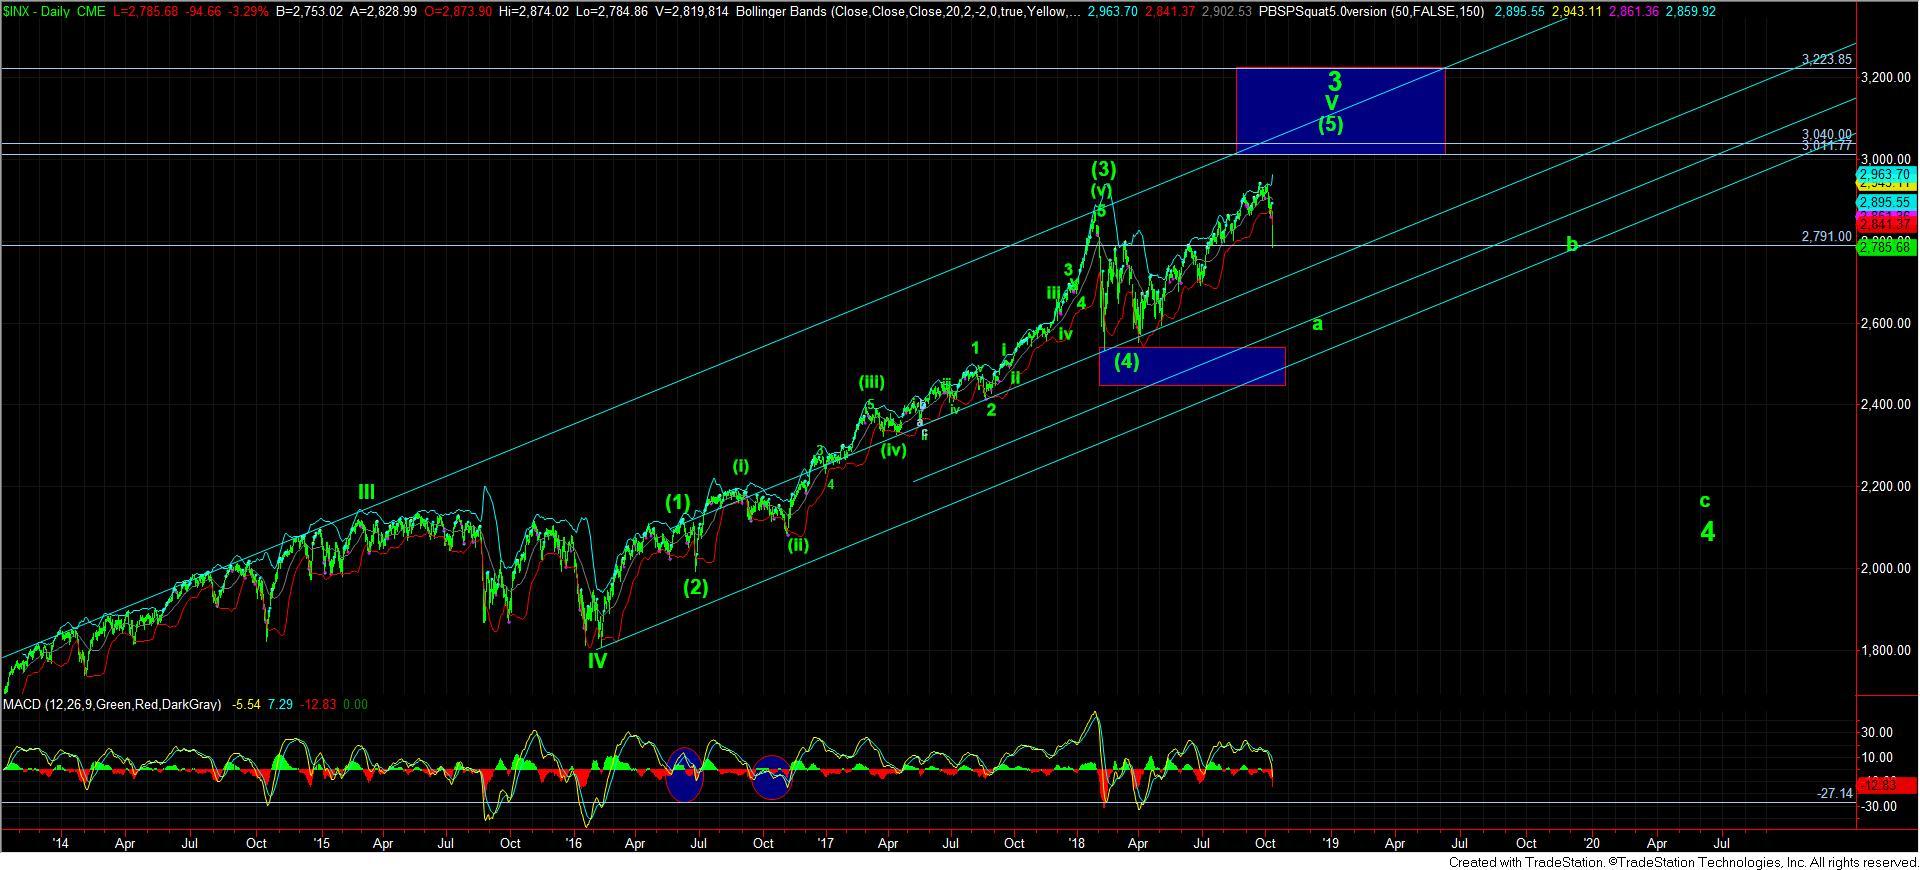
To add to the treacherous nature of the environment, when an ending diagonal completes, the reversal is quite strong. In fact, we usually see the market drop quite quickly back to the point of origin of the ending diagonal. In our case, that is the 2500-2600 SPX region, and that would likely only be the a-wave of wave 4, as shown on the daily chart.
So, as we move into a much more likely ending diagonal scenario, please recognize that risks have increased significantly on the long side. The only thing that could resurrect the more bullish perspective to 3225SPX for me would be an impulsive rally over 2990SPX. Barring that, I am going to treat the current structure for wave (5) was being an ending diagonal. . . .
This brings me back to the warning I have been posting the last month or two. We are now approaching the top to wave 3 off the 2009 lows. That means that when this completes, potentially as early as the end of this year, we will likely begin a 20-30% correction which can drop us down as deep as the 2100SPX region. So, please consider the risk inherent in the market over the next few months.”
Now, while we have hit my target of a spike below the 2791SPX region, we still do not have a reversal to confirm this is wave (iv) of the ending diagonal. Moreover, clearly I was not expecting this c-wave to break us below the 2791SPX level in one day.
So, the question is now if the market is going to provide us with a strong statement by gapping us up tomorrow to begin confirmation that wave (iv) is done with a rally through 2825, with follow through over 2850SPX. If not, the weight of evidence suggests that we are heading down to the 2600SPX region for the a-wave of wave 4, as seen on the daily chart.
A number of you have asked me whether we can still see 3000 next year. And, should we drop directly down to the 2600SPX there is only one possibility that can still point us back up over 3000 into 2019 . . and that is the top we just struck is only a b-wave of a larger degree wave (4) of 3. But, I will warn you that the market has a LOT to prove for this to be the case. Should we drop down to 2600SPX, then my primary expectation is that wave 3 has ended, and we are now in wave 4, which should take us the better part of the next year or so. But, I will maintain an open mind should we bottom at 2600SPX, and then see a CLEAR impulsive rally off that low.
For now, I think tomorrow is one of the more important days we have seen in quite some time. A continuation lower below 2770SPX will make a strong statement to me, and point us down to the 2600SPX region. Otherwise, should we hold support, and rally through 2825/50SPX, that keeps us strongly looking higher to the 3011-3040SPX region later this year.
But, as I have been strongly warning, especially since we broke down below 2880SPX, the risks on the long side have risen dramatically, and I clearly still maintain that perspective.