Quite The Impressive Rally
While I remained adamant for many months while others were bearish that we would rally to 4300+, I did not expect we would rally directly to the 4550SPX region, as I had initially thought we would top out around the 4375-4433SPX region. So, this rally has been quite impressive.
Yet, that does not mean I throw all caution to the wind, and jump back into the long side of the market. As I noted in the weekend analysis, there are even aspects of this that remind me of the extensions we saw in early 2020. I am not saying we will certainly see the same resolution. Rather, that will depend on the structure of the next decline.
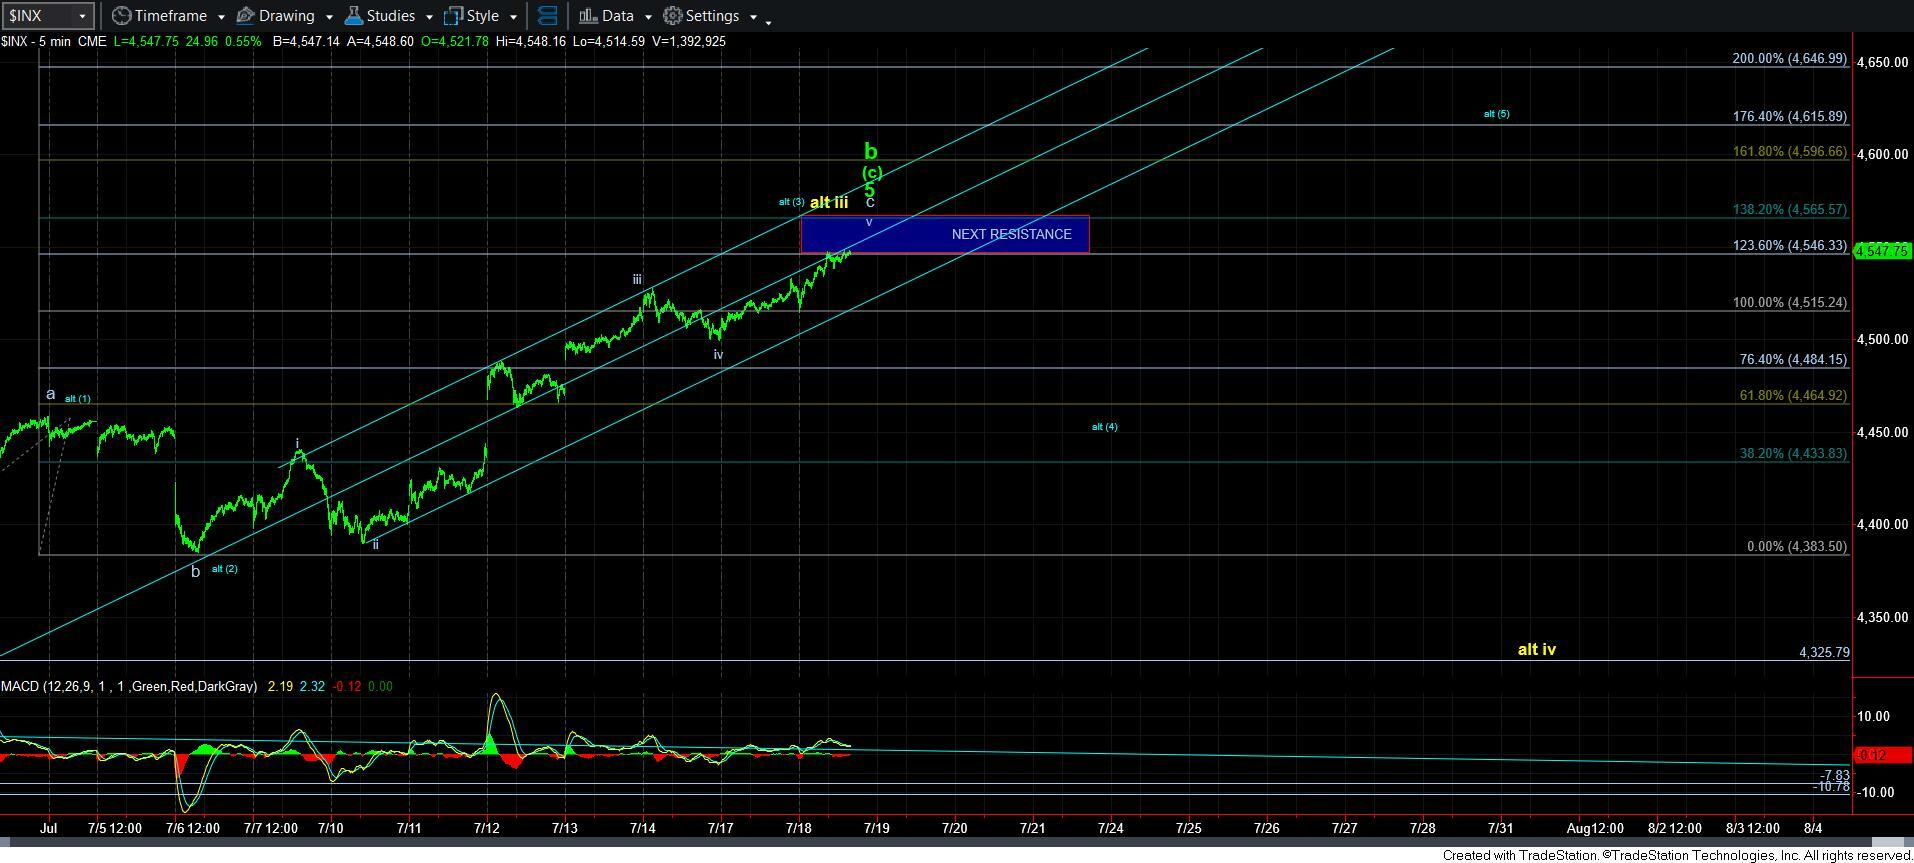
So, that now brings me to the point I am going to make again, which will make me sound like a broken record. With the market approaching the 1.236 extension of the initial moves off the October 2022 low, it is rather clear that the market is a bit stretched in my opinion.
Does that mean it cannot stretch further? Absolutely not. As Keynes said, “the market can remain irrational longer than you can remain solvent.” For this reason (as well as the fact that I have always questioned whether we would get another higher high relative to 2021 due to the incomplete pattern), I have been strongly urging members to avoid shorting this market. Should the market begin to drop in a clearly impulsive manner, there will be plenty of downside to garner. Yet, I would want to have confirmation of that potential before I would advise shorting such a seemingly resilient market.
In the meantime, the market is now stretching to the next target region we set on our charts between 4550-65SPX region. And, I still have no sign that a top has yet been struck. We would now need to see a break-down below 4500SPX, with a sustained break of 4450SPX to confirm a top is likely in place. And, as I have been saying over and over, the nature of that decline will instruct us as to whether we will be looking higher to the 4800SPX region next, or if the market is indeed going to drop and set up a crash later this year.
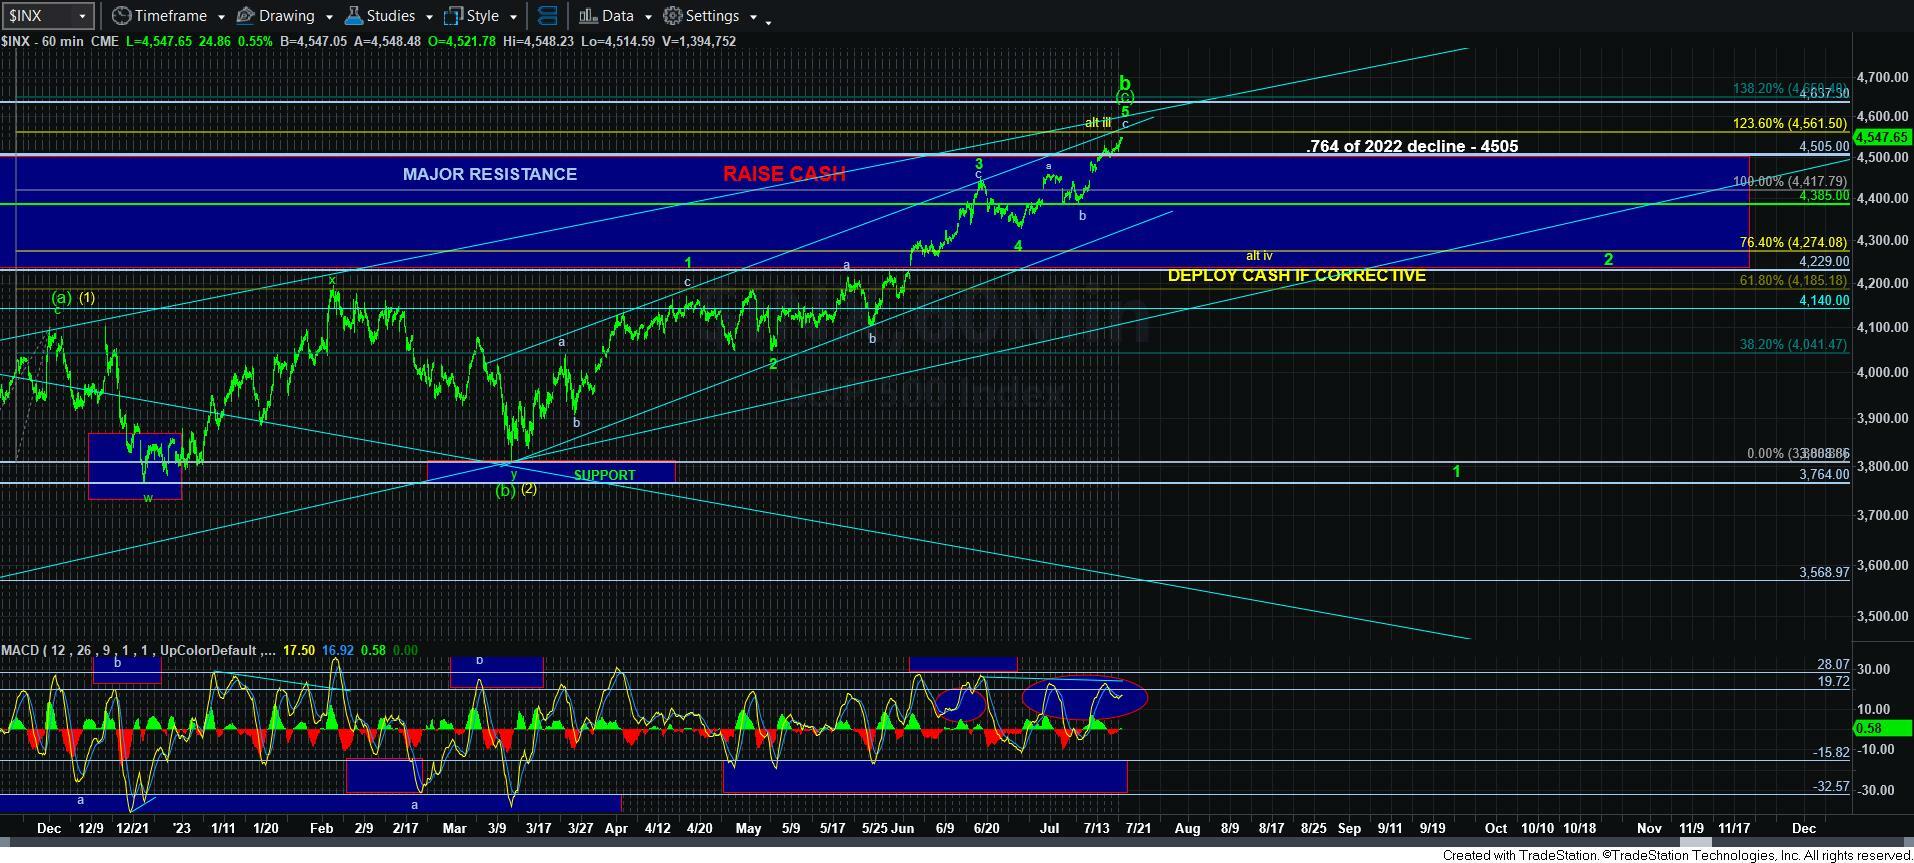
If you look at the attached 60-minute chart, not only will you see us approaching the 1.236 extension, in addition to a conversion of trend channels overhead and negative divergences in the MACD, you will also see that I have added a “deploy cash” instruction should the market next pullback in a clearly corrective manner. Remember, if we see a corrective pullback below 4450SPX, that will likely suggest that the yellow wave iv is in progress, which will likely then set us up to rally to 4800SPX in wave v. And, for now, I am still leaving that as my alternative count until the market proves its intention with a clearly corrective pullback.
So, in the meantime, I am again going to suggest that it is prudent to reel in any FOMO feelings you may have, as I still do not see any clear set up that suggests we are going to 4800SPX in a direct manner. But, continue to raise stops on the longs that you still hold. I personally raised a bit more cash yesterday, and am raising the stops on the remaining longs that I still hold.