Quick Update - Market Analysis for Apr 10th, 2024
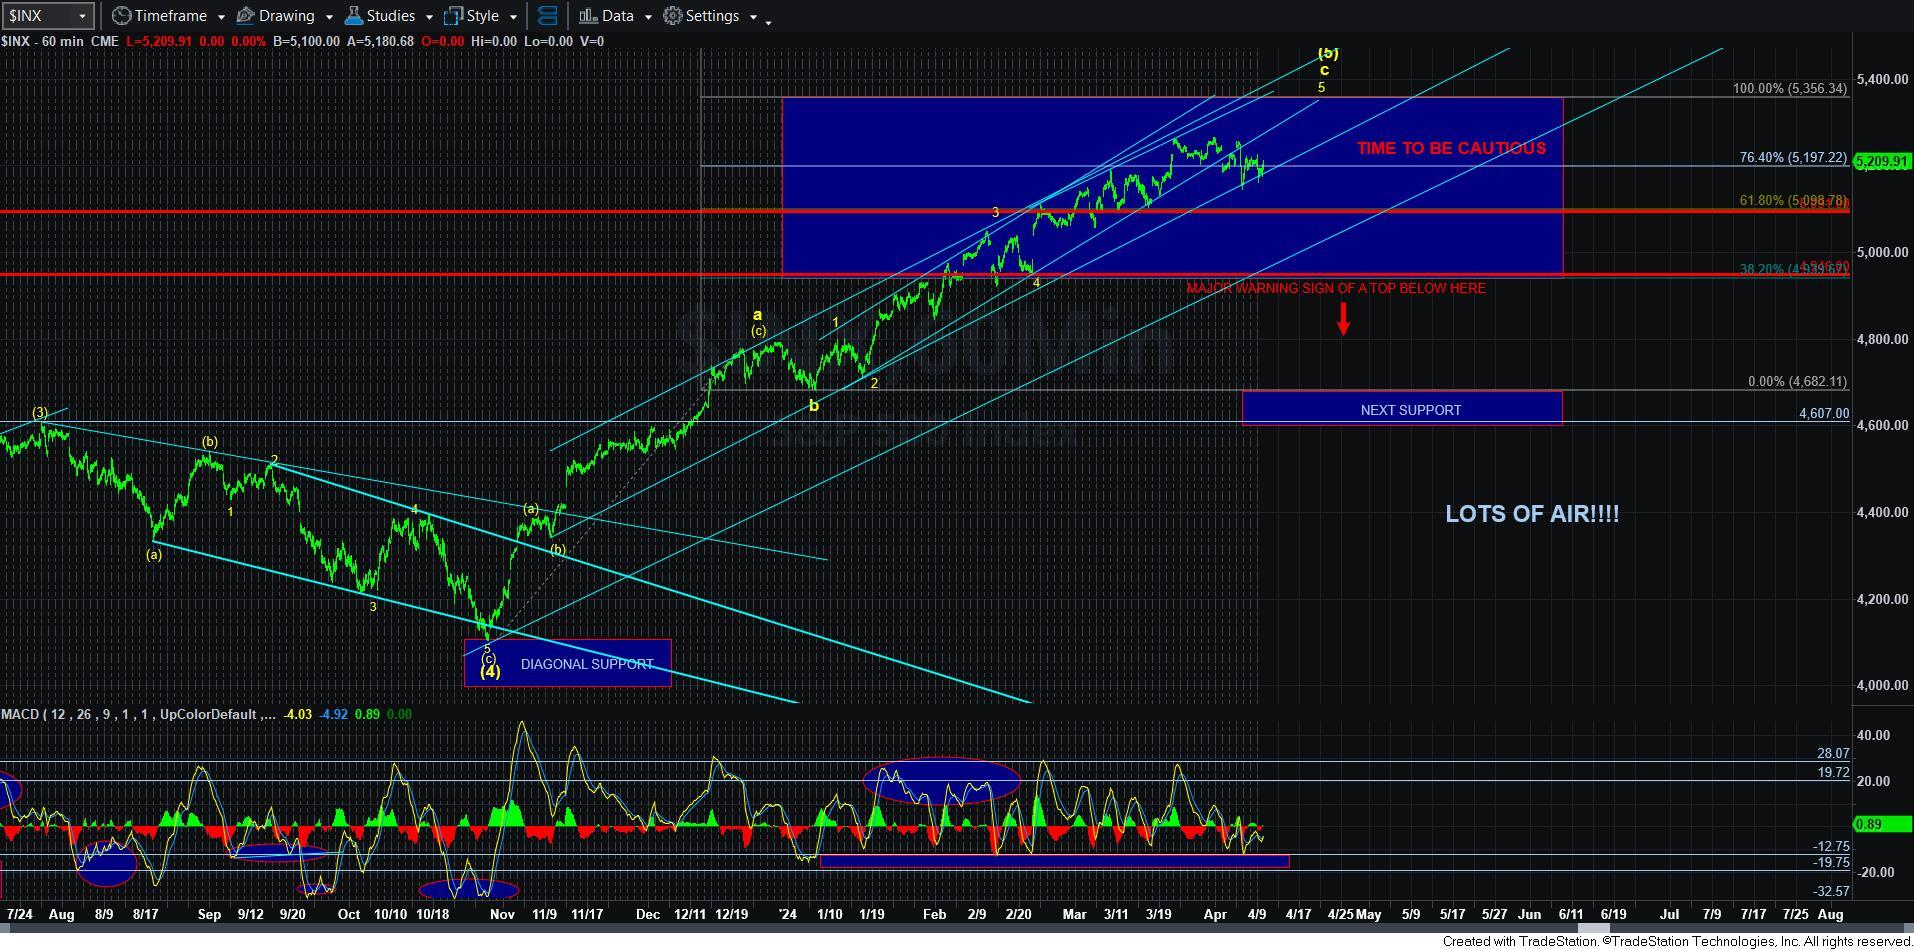
The set up the market left us with yesterday has clearly not followed through to the upside. However, as you can tell from my 60-minute chart, caution has been warranted for some time now.
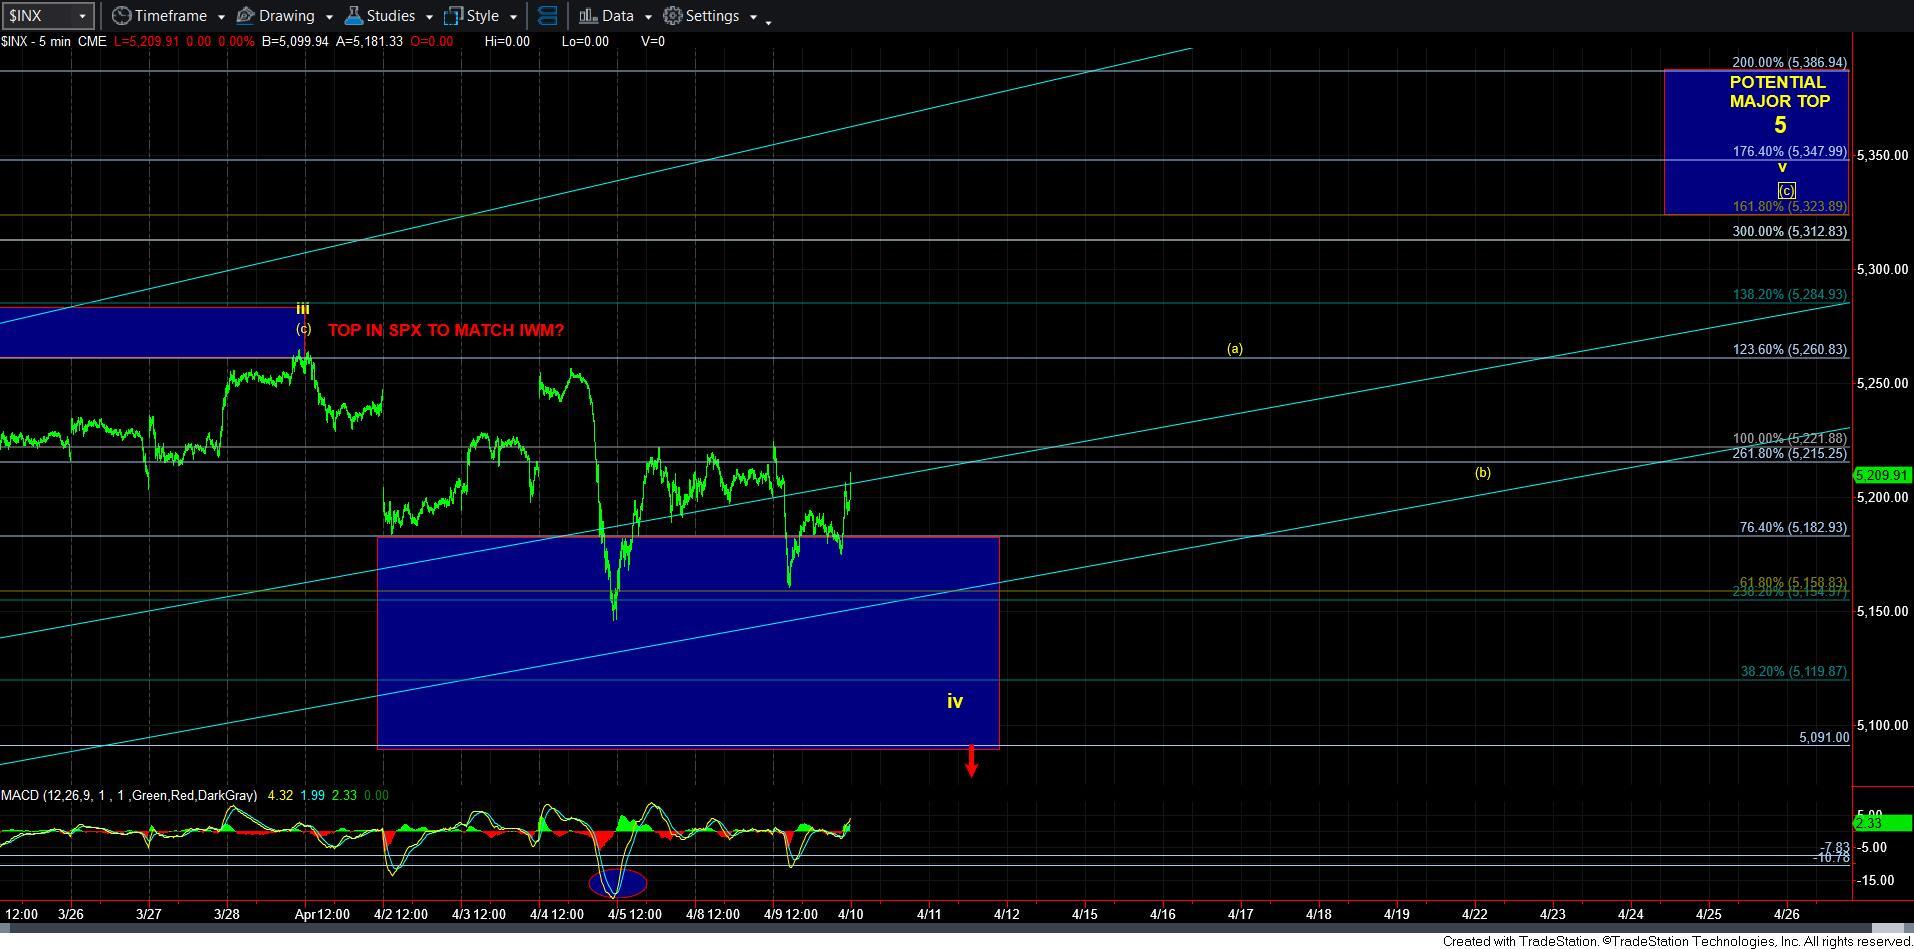
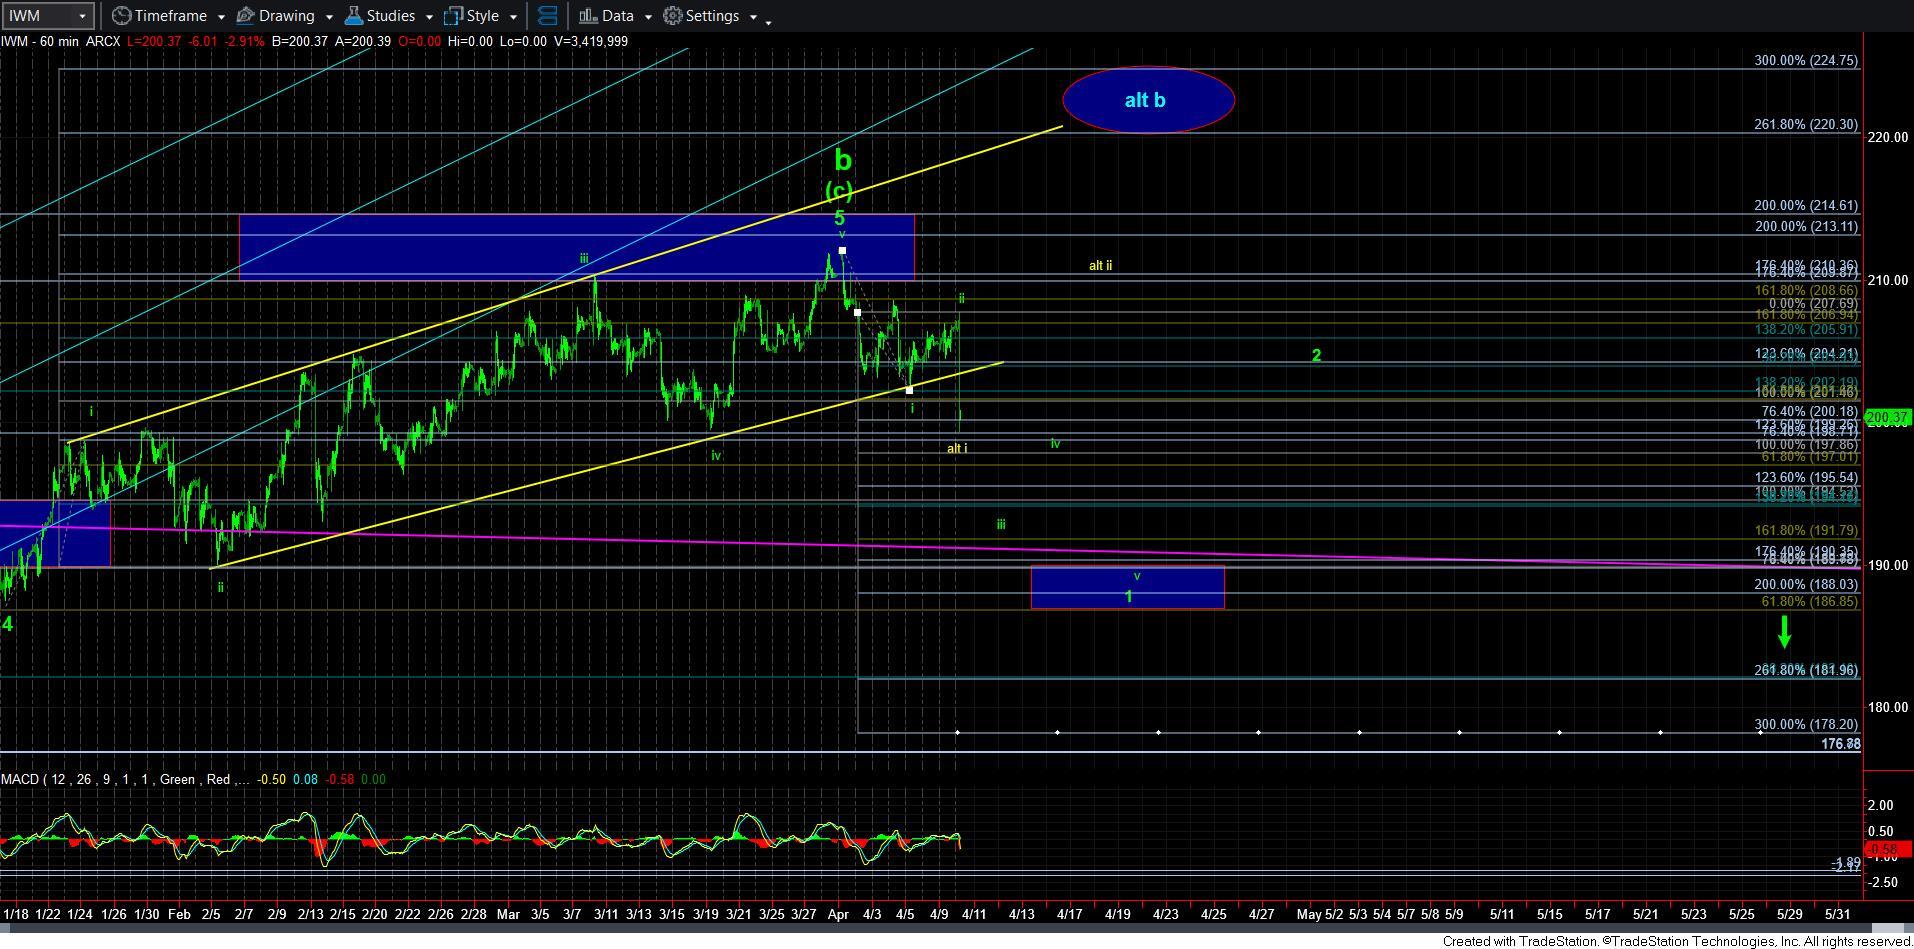
While I have outlined the potential for the IWM to have already topped, I am still not yet convinced the SPX has done so. Remember, I need to see a CLEAR and sustained break of 5091SPX to really begin that process. Moreover, should the IWM complete 5 waves to the downside, as outlined on the 60-minute chart, that would be a VERY bearish indication for the rest of 2024, after we see a 2nd wave bounce.
In the meantime, there is some potential this is just the 5th wave in wave i down, which is now an alternative count I have in yellow on the IWM chart. We need to break down below 197 to get this 5 wave decline moving down in earnest. Over it, and we may still get a bigger wave ii bounce.
So, what I am saying is nothing really different. We still need a sustained break of 5091SPX (with follow through below 4946SPX) to suggest a major top has potentially been struck in the larger equity market. Should that be coupled with a 5-wave decline in IWM, then that would be a VERY bearish indication for the rest of 2024. Until such time, we have to remember that diagonals provide a lot of volatility, especially as they are completing. So, this one has not yet told us it has yet completed in SPX, especially since there is still potential for one more rally before it does.
Please make sure you are following the parameters.