Questioning a b-Wave Rally
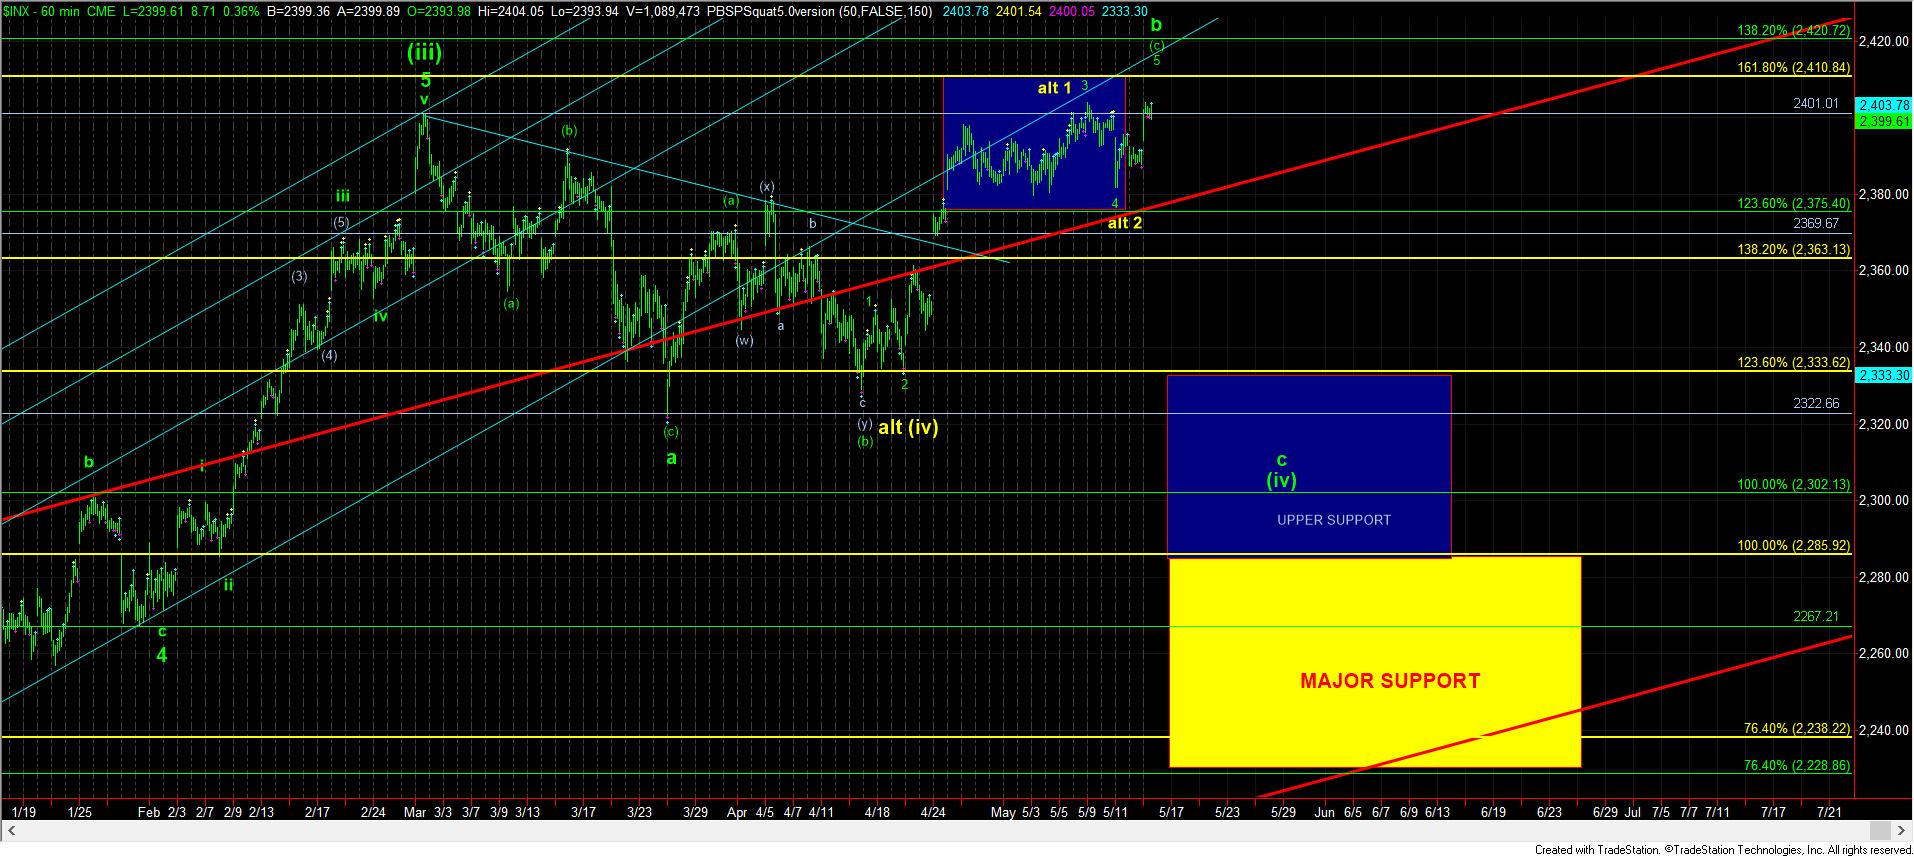
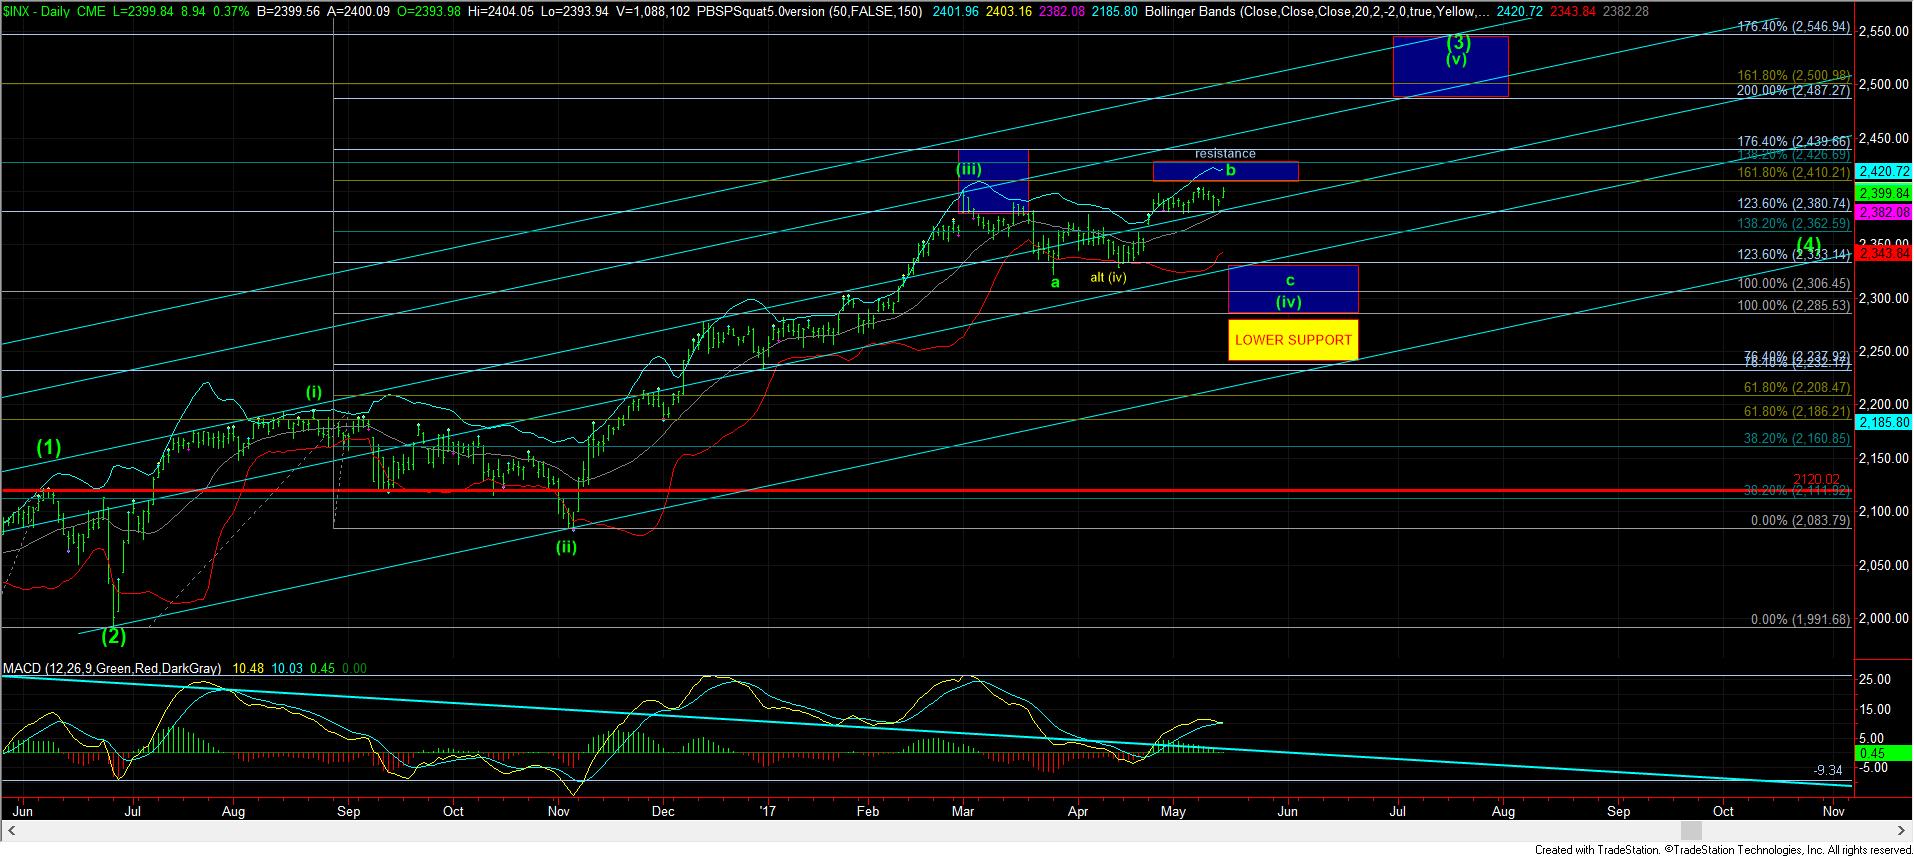
The market’s drop last week provided us with an immediate set up for the c-wave down which we have been expecting. However, today, the market invalidated that IMMEDIATE set up for the c-wave. And, when the market has the opportunity to follow through on a primary pattern, and chooses not to do so, it places questions in my mind if that is the true market intention.
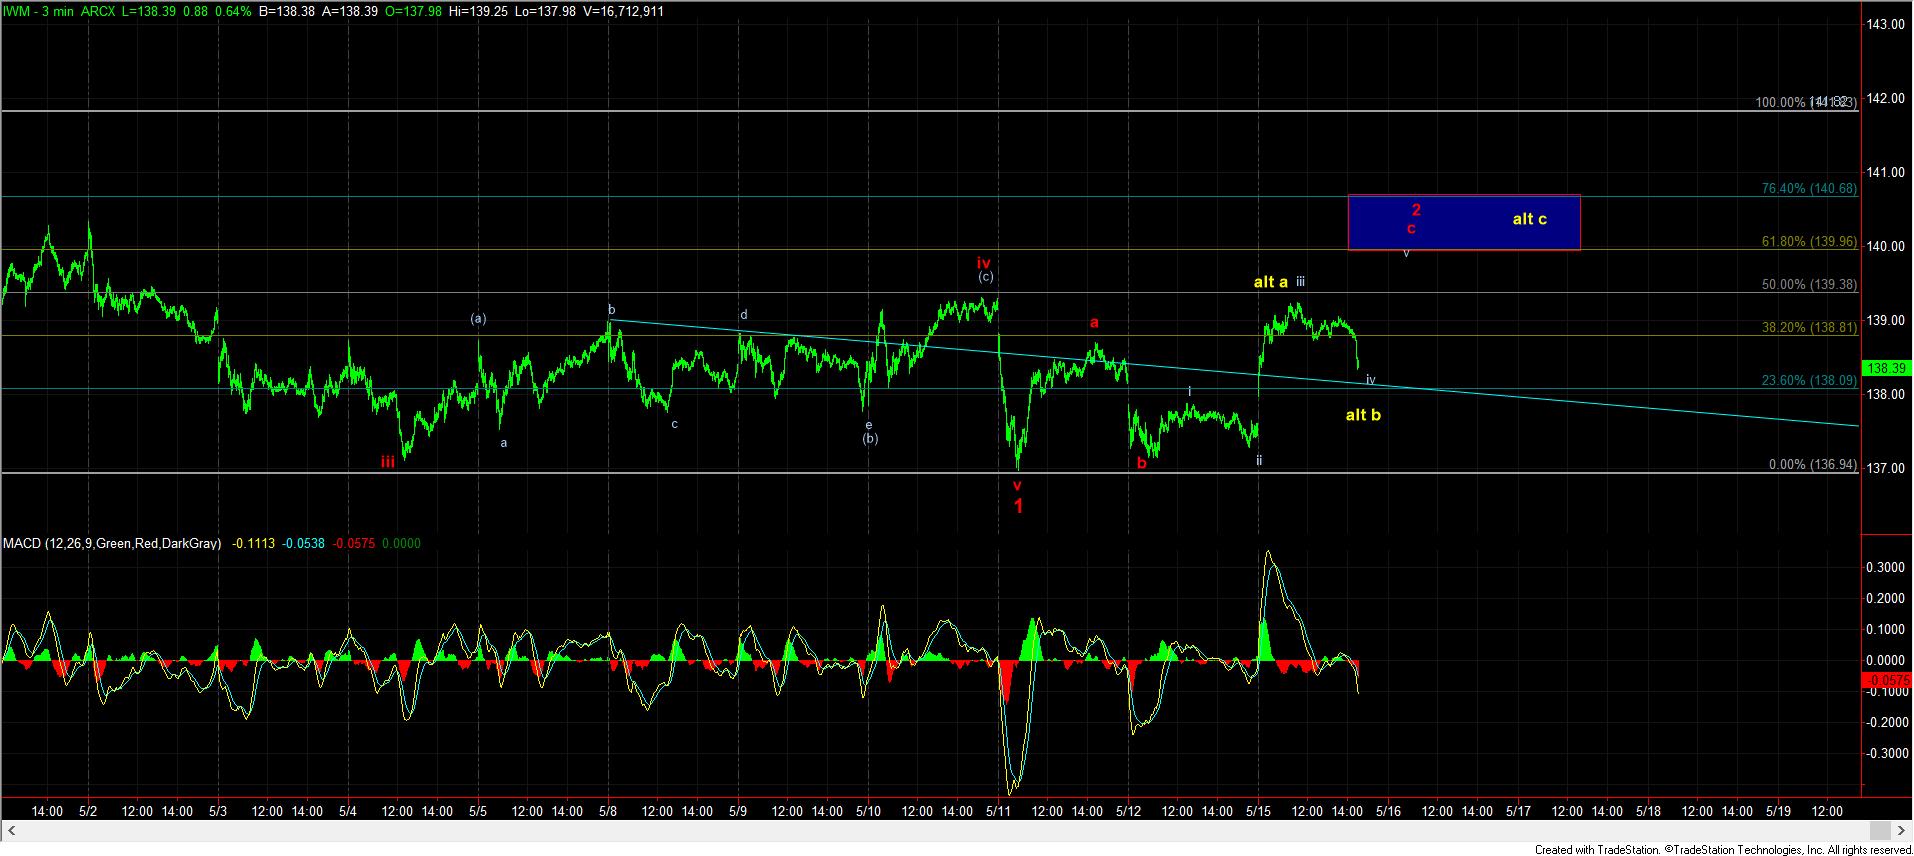
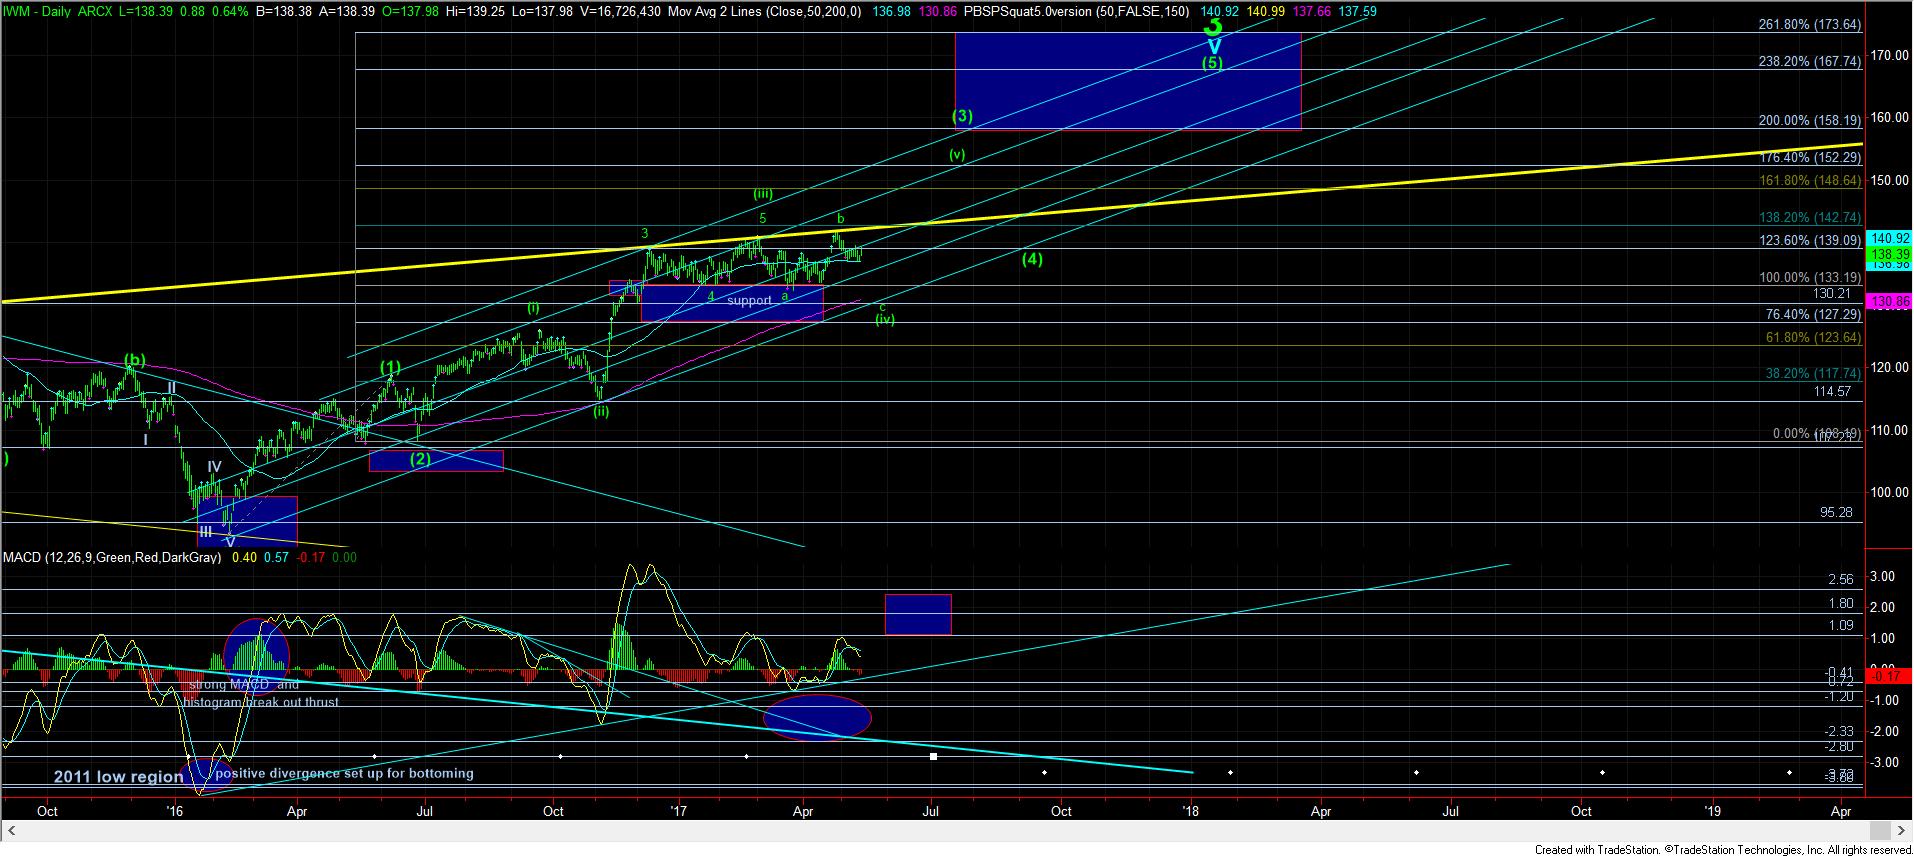
What keeps me solidly looking for that c-wave down is the pattern in the IWM. As you can see from the attached charts, we have a very nice 5 wave decline in the IWM, after a 3 wave rally from the March lows. That strongly suggests that the IWM has topped in its b-wave, and has already completed wave 1 of the c-wave down. Currently, we seem to be completing wave 2 in that c-wave down.
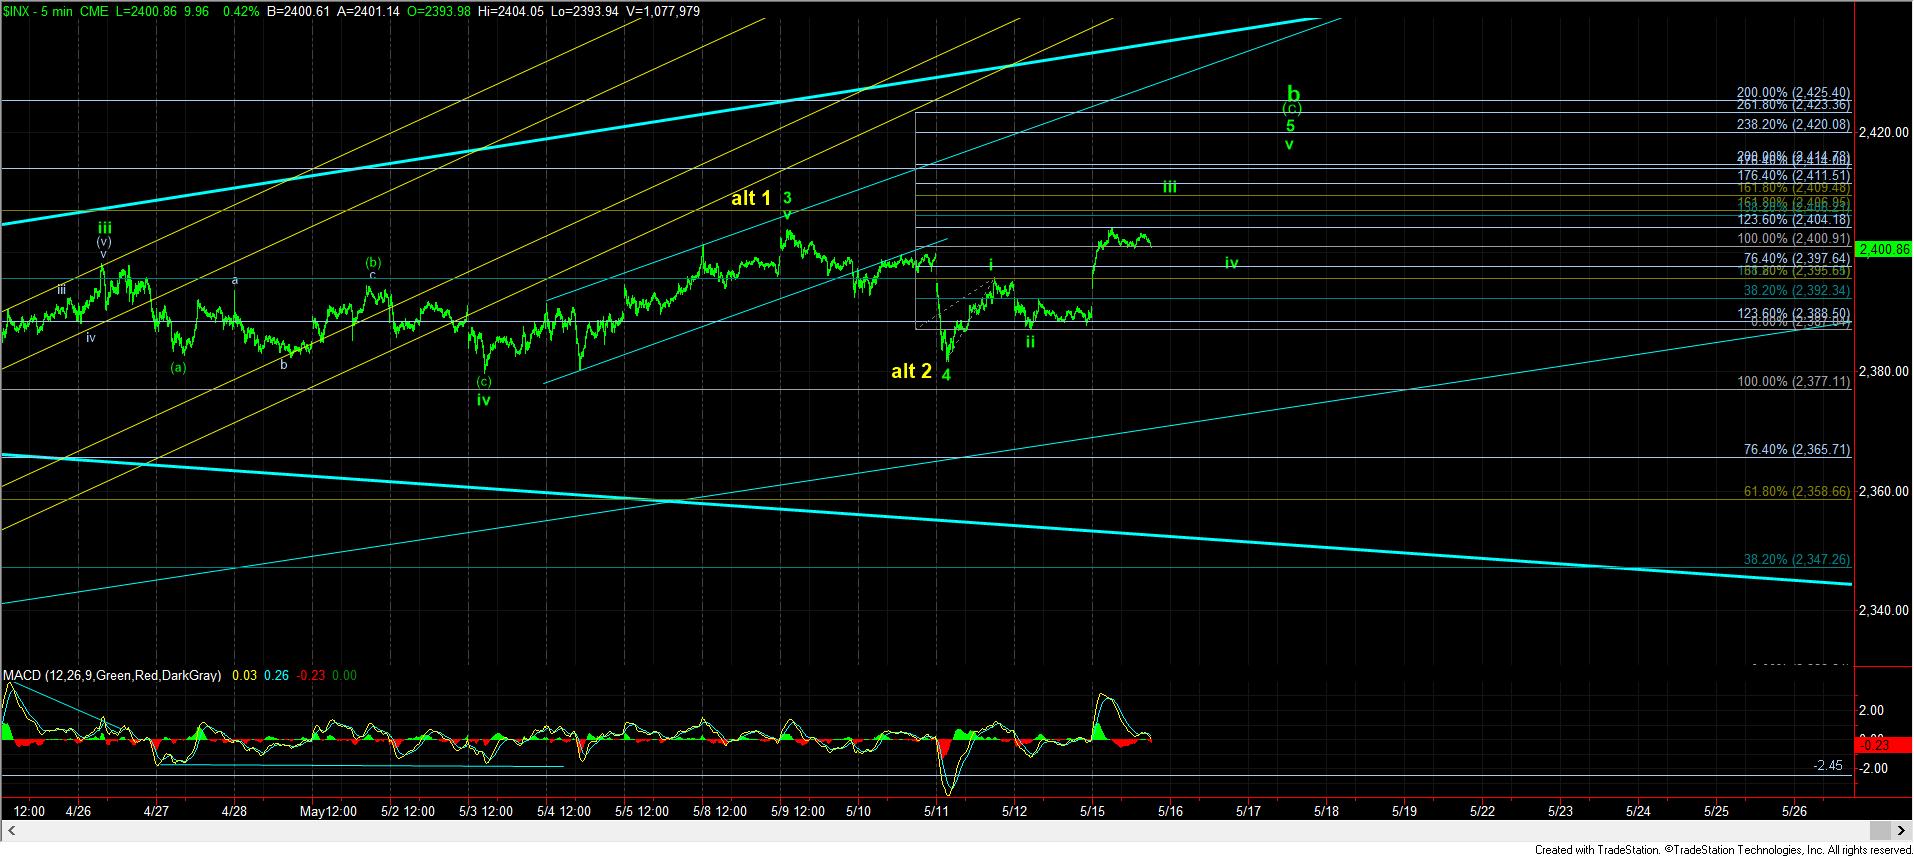
Based upon the micro pattern off last week’s pullback low in SPX, it would seem we are trying to complete waves iii,iv, and v in wave 5 of the (c) wave of the b-wave, as revised to the 5 minute chart. My preference was to have seen this completed last week, but the market does not always do what I prefer. The difference between this count and the one I maintained last week relied upon a very small wave iv and v in wave 3, whereas this one provides a much more defined and drawn out wave iv structure within wave 3.
I have also added back the yellow 1-2 structure as my ALTERNATIVE. Again, please read that carefully, as it is not my primary. But, should we rally through the 2425SPX level strongly, as a 3rd wave would, then I would adopt the yellow count as a much stronger potential, which would likely target the 2537SPX region. But, again, this is only the alternative count, as I presented it over the last week or two.
For now, I am still looking for a market “top” of sorts, but by no means do I think the market has seen its high. I will now need to see the SPX break below 2381SPX in an impulsive fashion to suggest that the c-wave down has begun in earnest.

