Questioning A Pullback - Market Analysis for Nov 22nd, 2016
Sorry, the last one had a few typos on the levels. My apologies:
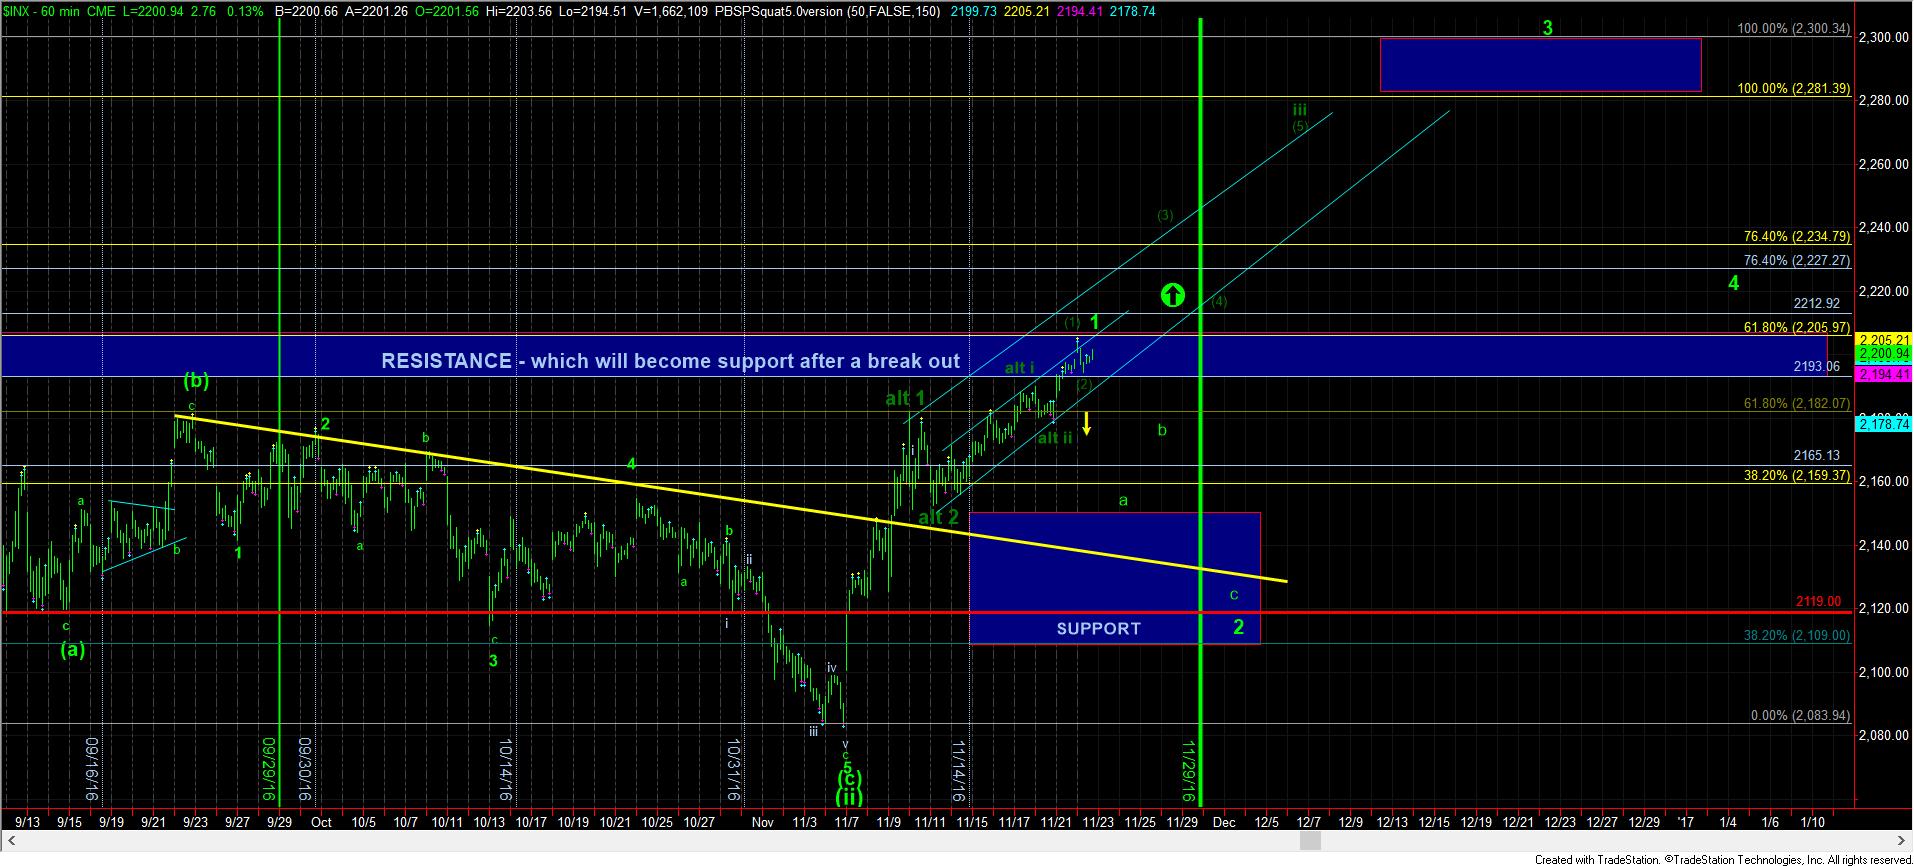
While my primary expectation has been to look for a wave 2 pullback in the market into the end of the month, the action today has certainly made me question that potential.
The pullback we have seen thus far from the top end of the resistance region has not been able to exceed a micro .382 retracement of what I have labeled in the alternative count as wave (1) of iii of 3. If we are not able to break below that, or if we are not able to follow through to the downside below 2189SPX, but, rather, break out over 2215SPX, that would make me move to my alternative, and more immediately bullish perspective, that wave 2 is complete as shown in the dark green count, and that we are on our way to the 2280-2300 SPX region for our Santa rally.
Remember, we are likely setting up in the heart of a 3rd wave, and during this segment of the move, retracements can and often are quite shallow. We may be experiencing that in this current region.
Again, our upper micro-support resides at 2189SPX, and unless we can break down below that, with follow through below 2180SPX, we have to consider that wave 2 may have already completed, especially if we move strongly through the 2215SPX region.
But, for now, I am going to maintain my primary expectation for a wave 2 pullback, but I will admit it is on shaky ground after today’s market action.
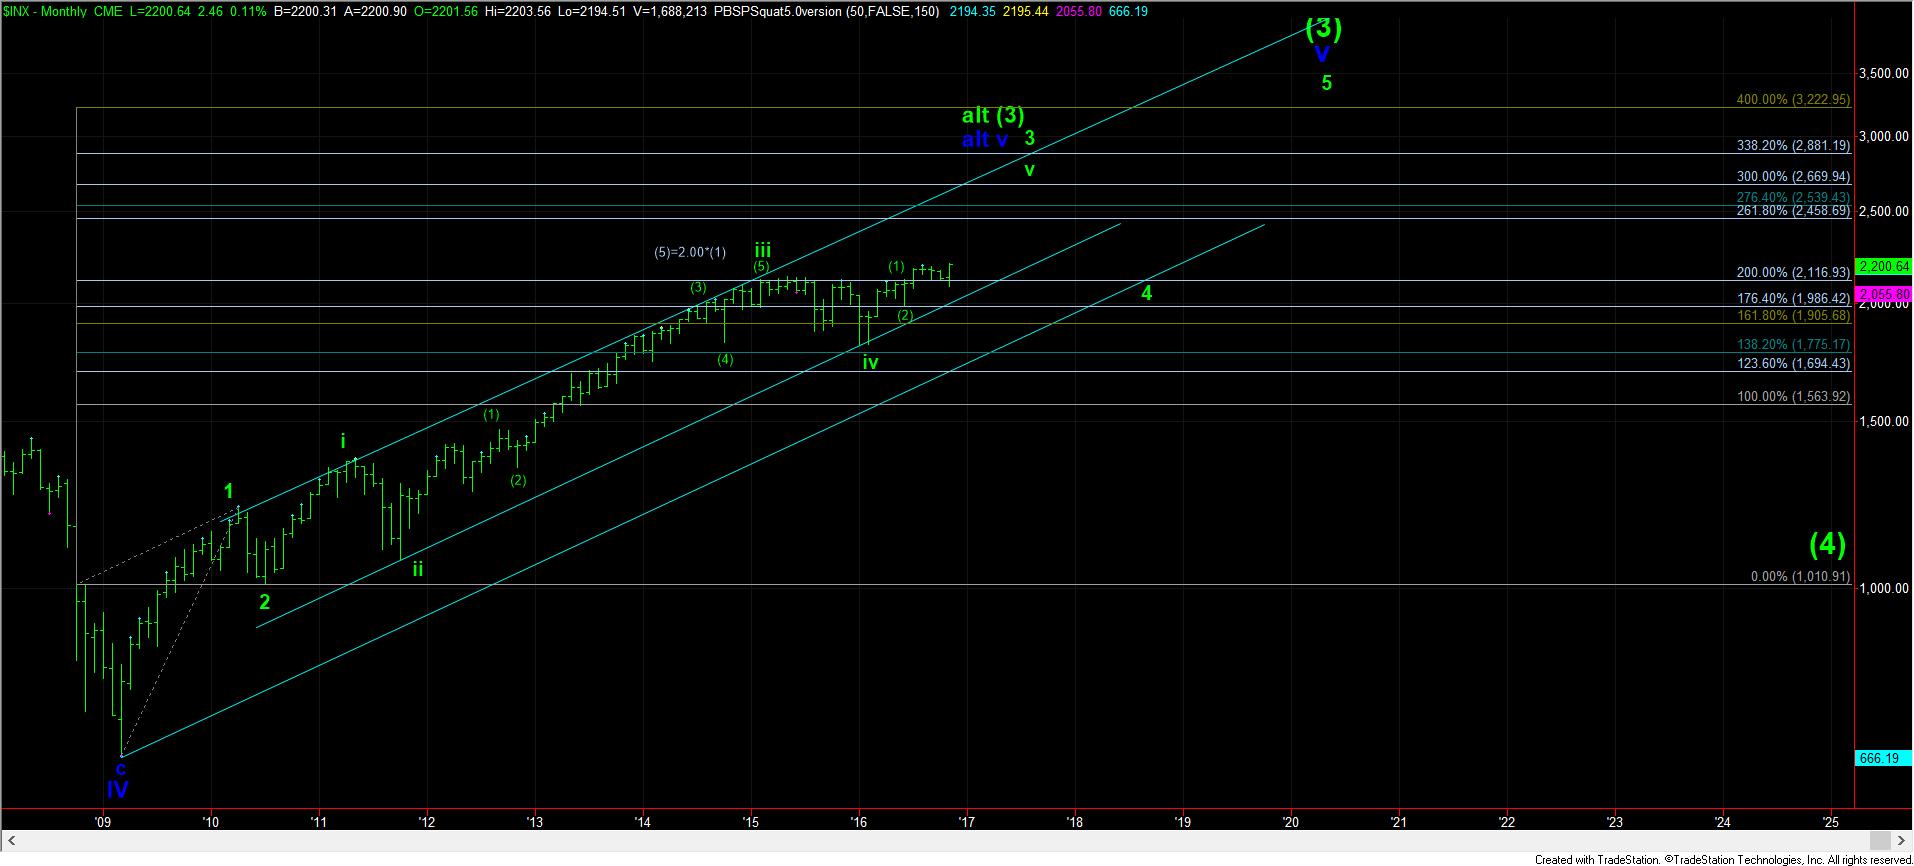
On the bigger picture, I would like to note something very important from a simple technical analysis perspective, which I mentioned in the trading room this morning. As you can see from the attached SPX monthly chart, we had been consolidating for a year and a half in a 4th wave below a long-term Fib level around the 2115SPX region. This year, we broke out through that region, and have spent the better part of the last few months basically consolidating over that region. This is typically bullish market action, and suggests that we are likely setting up to continue higher in the long-term trend. And, at this point, it would take a break down below 2120SPX to even make me reconsider that perspective.