Putting The Market Into Context
This update is going to present ideas I tried to convey in my live video this morning, but I wanted to put this into writing.
First, I want you to recognize that there is no other methodology that can put the market into context as Elliott Wave analysis does. Allow me to explain.
When the market was bottoming out back in March, we recognized it as a bottoming, but were uncertain if the next rally would confirm that the market had completed a 2+ year correction or if there was going to be one more lower low before it completed. This alone suggests a context that you could not glean unless you utilized Elliott Wave analysis.
Once the market rallied up to our initial target in the 2600-2725 region on the S&P 500 (SPX), the structure told us that we were likely heading up to the 2890 region before the potential for a larger pullback can be seen. Again, this context was gleaned from an Elliott Wave and Fibonacci Pinball perspective.
Once the market struck the 2890 SPX region in what seemed to be 3 waves up off the lows, our Fibonacci Pinball methodology suggested that a test of the 2700 region was going to be expected from that resistance. Again, this is only something you can glean with our Fibonacci Pinball method of EW.
And, if the market pulled back correctively from that 2890 SPX resistance and held support at the 2700 region, then it pointed up to the 3000+ region next. And, again, context being provided by our Fibonacci Pinball method of EW.
But, the other context which the market provided to us was something I outlined yesterday from a risk management perspective.
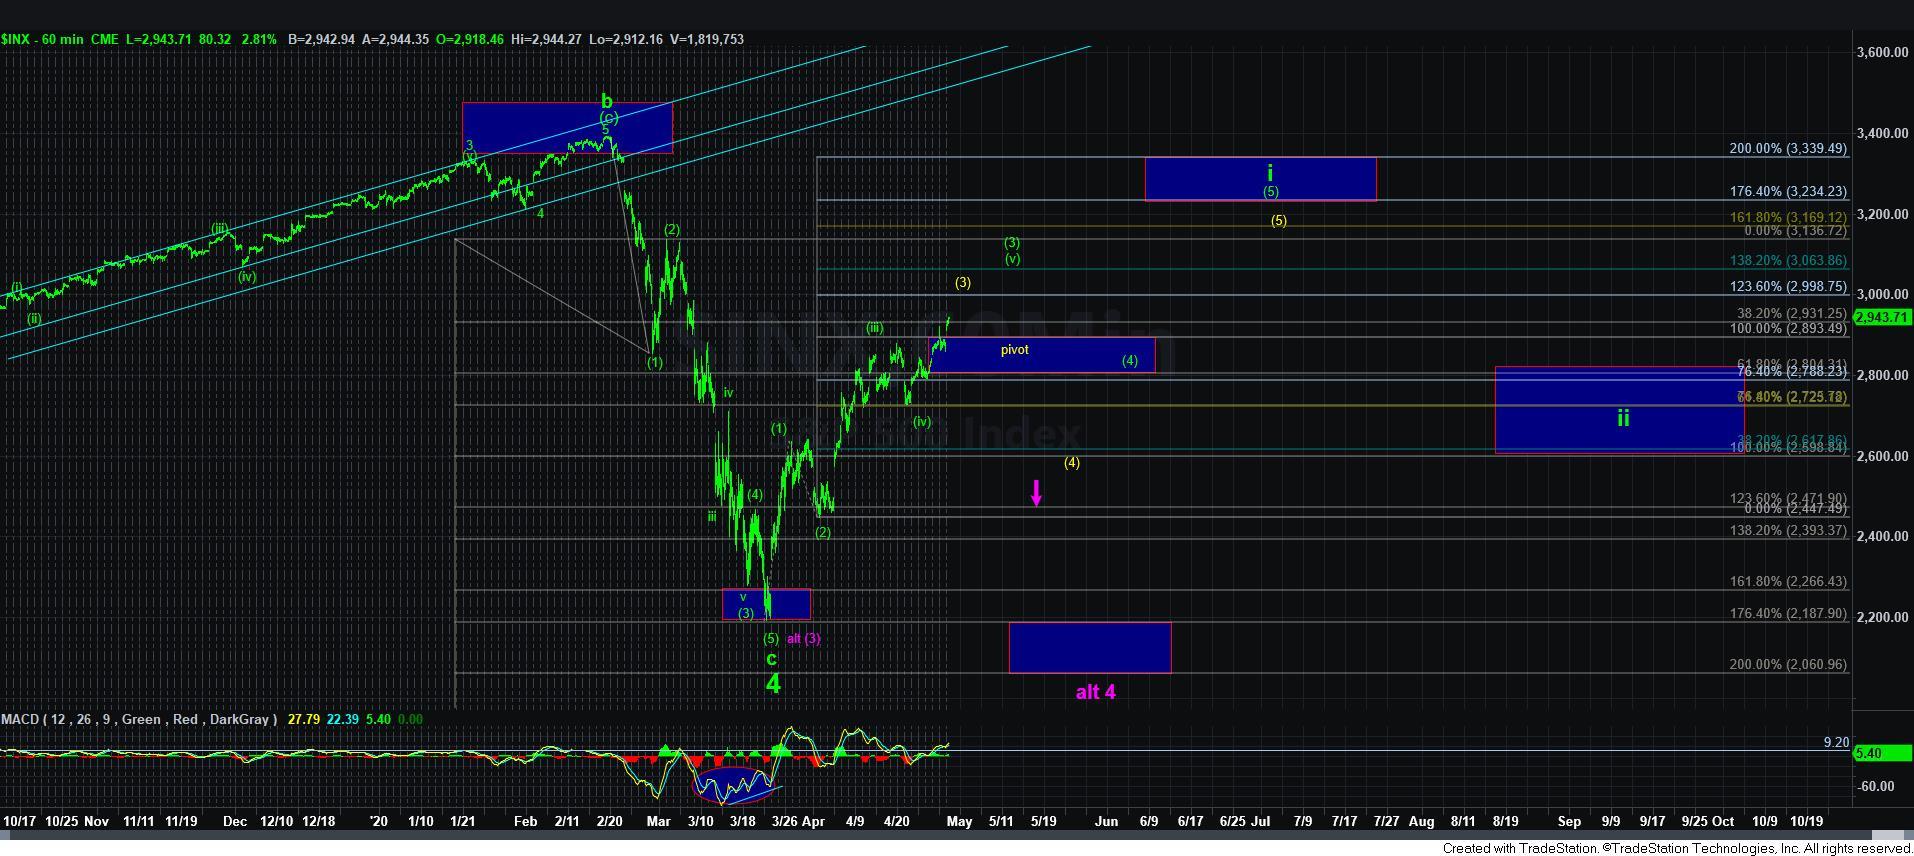
You see, until the SPX actually completes 5-waves up off its 2191 bottom, we cannot be highly confident that the market has bottomed, and has begun the rally to the 4000-6000 region we expect in the coming years. Moreover, we have a target around the 3200-3300 region on the SPX for that 5 wave structure off the 2191 low based upon our Fibonacci Pinball methodology. This then tells us that when we were in the 2900 region, the market has completed 70% of that rally. It also means that the last 30% of the move provides us with the most questions, as we do not know if the market will complete that 5-wave structure or not.
When you consider that the last 30% of the rally has the most risk, and even if the market does complete all 5 waves up into the 3200-3300 SPX region it will still pullback below 2900 in wave ii later this year, you have to really consider whether you, as an investor, wants to take that additional risk or if it is even worth it to take that risk. Again, this is context that only our Fibonacci Pinball Elliott Wave methodology can provide to you. In fact, I know of no other methodology that can provide market context in this manner.
So, this is the more of a detailed outline of why I sent out my update yesterday. Once we complete 5 waves up off the 2191 low, then we can begin to move from a point of questioning to a point of redirecting our focus on buying the dips for the long term move we see to 4000+ on the SPX. I hope this explains my thinking process a bit better.
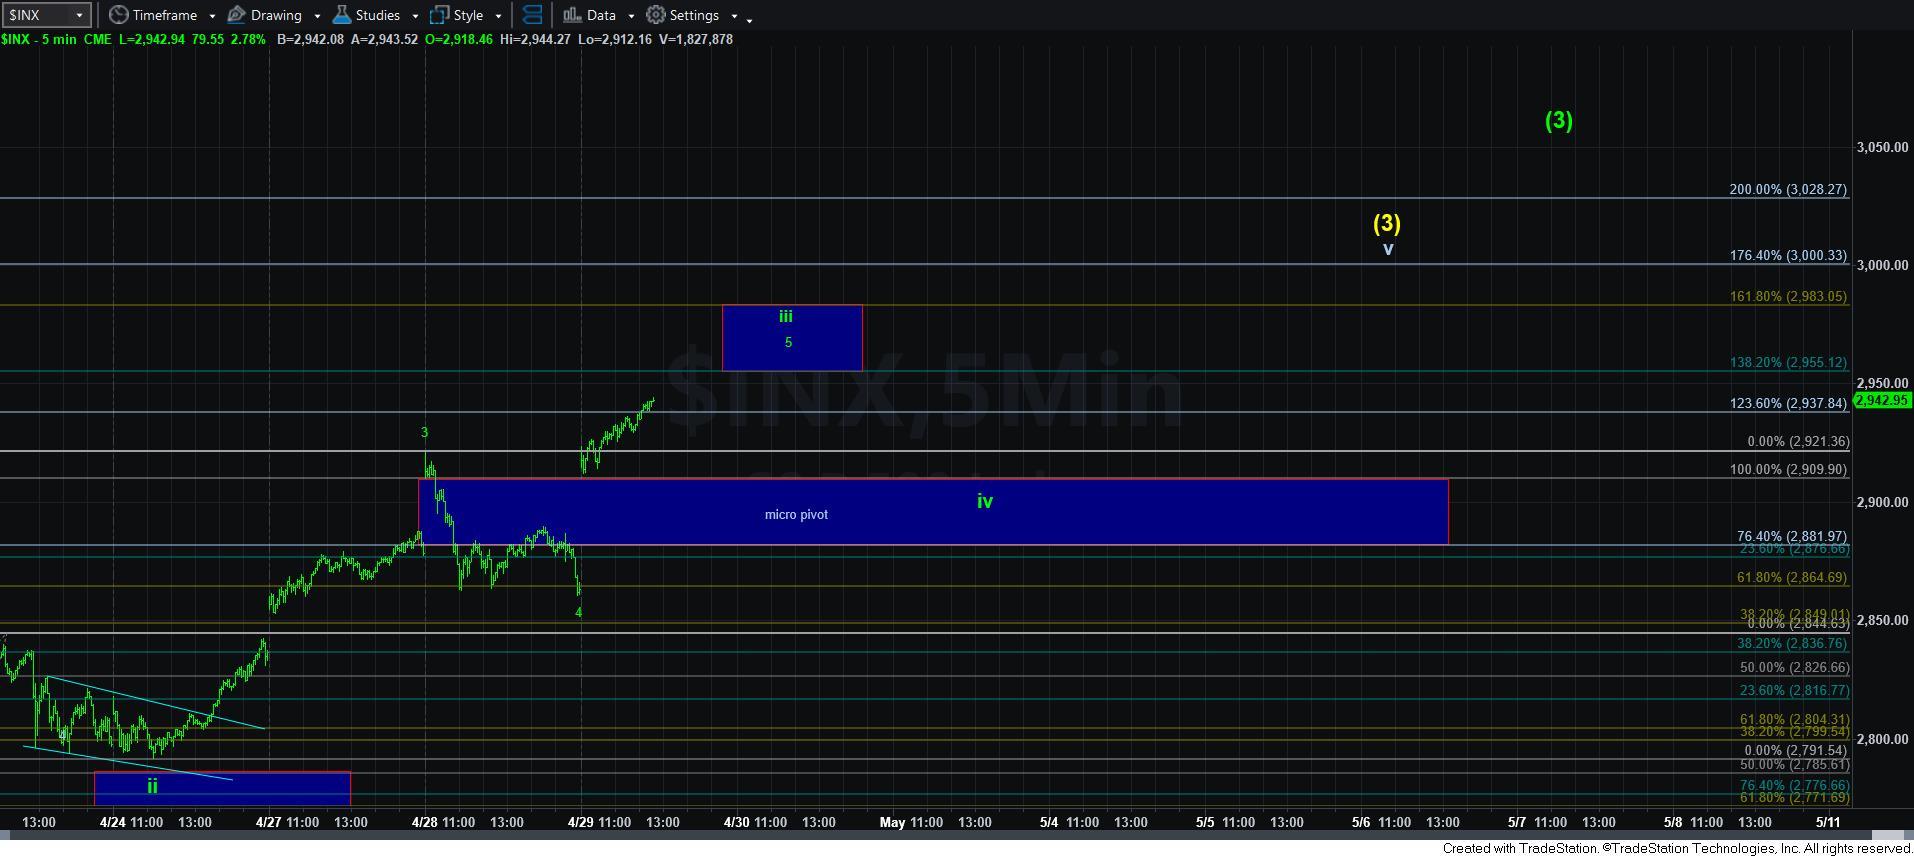
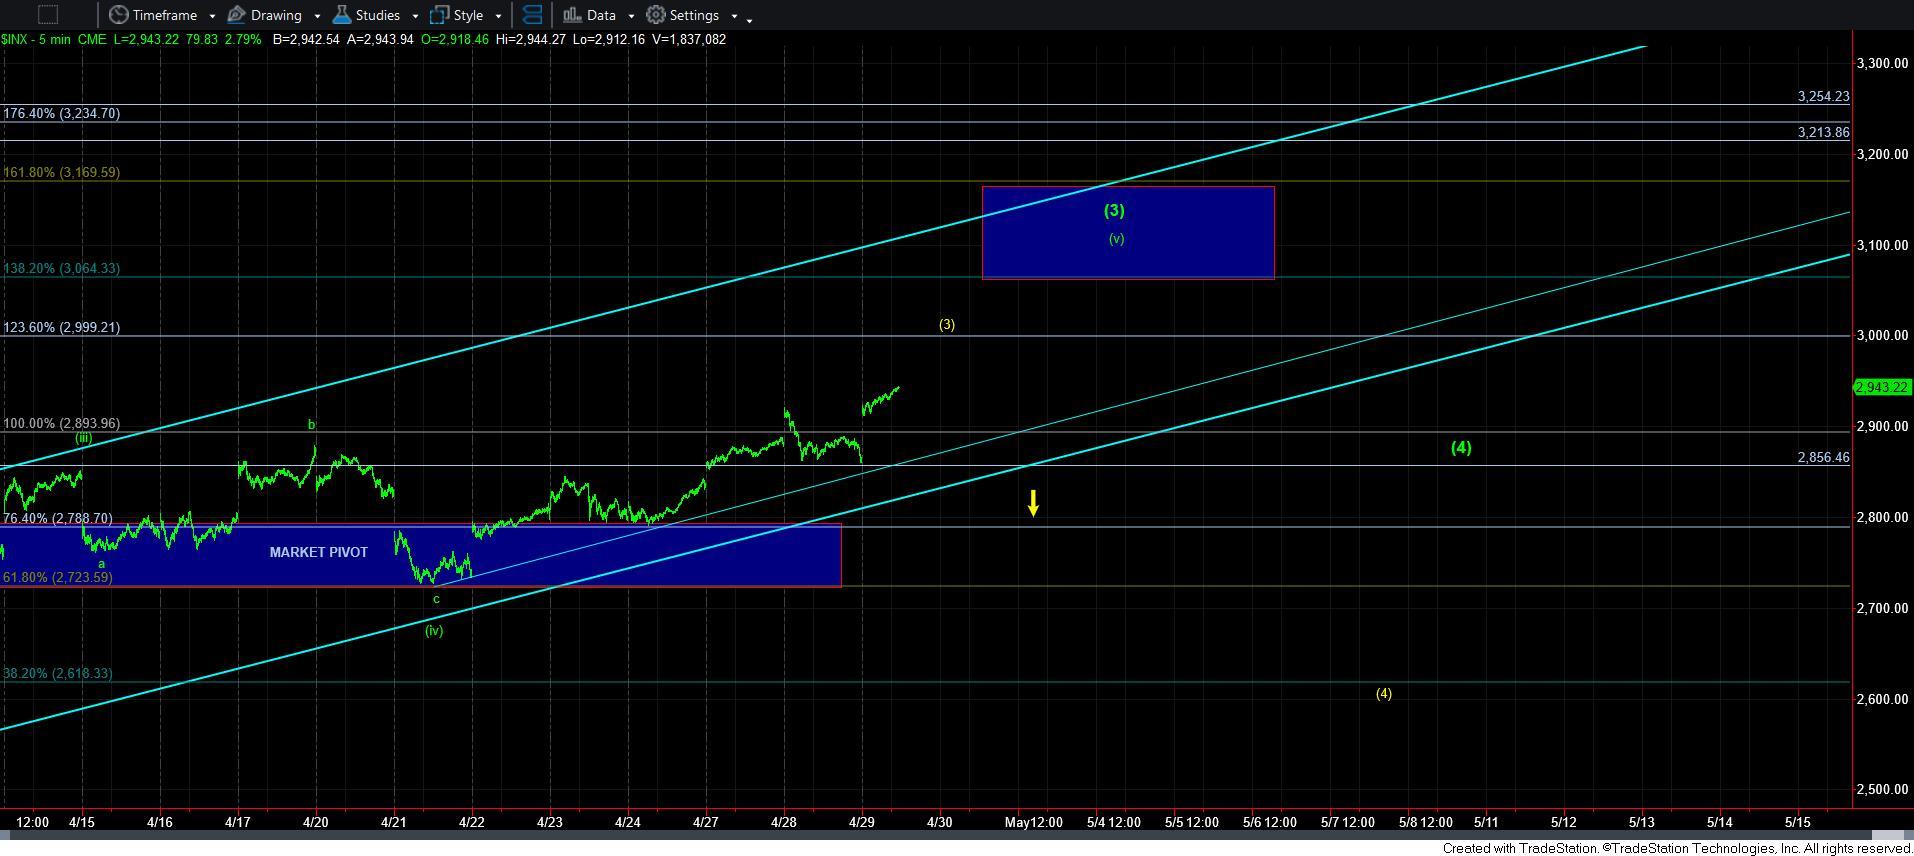
In the smaller degree structure, our old friend the 2880 level is now our floor. Ideally, we now hold over the 2900 break out point, as we continue to at least the 3000 SPX region.
But, I want to note that we really want to see the market continue to at least the 3060 region – the 1.382 extension of waves [1] and [2] off the lows – as that provides us with more confidence in the green standard impulsive count.
However, if the market tops out at the 3000 level on the SPX, and then breaks down below the 2880 level, it would suggest the yellow count – leading diagonal – is more likely. Normally, a standard impulsive structure takes us to the 1.382-1.618 extension for wave [3], whereas the wave [3] in a diagonal often targets the 1.236 extension of waves [1] and [2].
If we had not pulled back to the 2700 region from the 1.00 extension, I would be able to consider the move to the 1.236 extension as wave iii of [3]. But, based upon the structure of topping at the 1.00 and dropping to the .618 extension, I have to consider the top near the 1.00 as the wave iii of [3]. So, topping at the 1.236 in this structure would suggest this is wave [3] in a leading diagonal. (If this discussion is not clear, feel free to ask follow up questions, or review the Fibonacci Pinball videos in our library).
So, if we break down below 2880 on the SPX from here, then I have to assume we will drop down as deep as the 2600 region, as it is quite often that we see overlap with waves [1] and [4] within a diagonal, therefore that would have to be my target for a wave [4] if we break down below 2880 before striking at least the 3060 region on the SPX.
In conclusion, I hope you understand why I have outlined that risks have risen on the long side right now, and many of you may not want to take these additional risks or potential whipsaw before you get back involved on the long side of the market. The next two weeks will now provide us with the structure of how the SPX can complete this 5-wave rally off the 2191 low. But, it may be a wild ride.