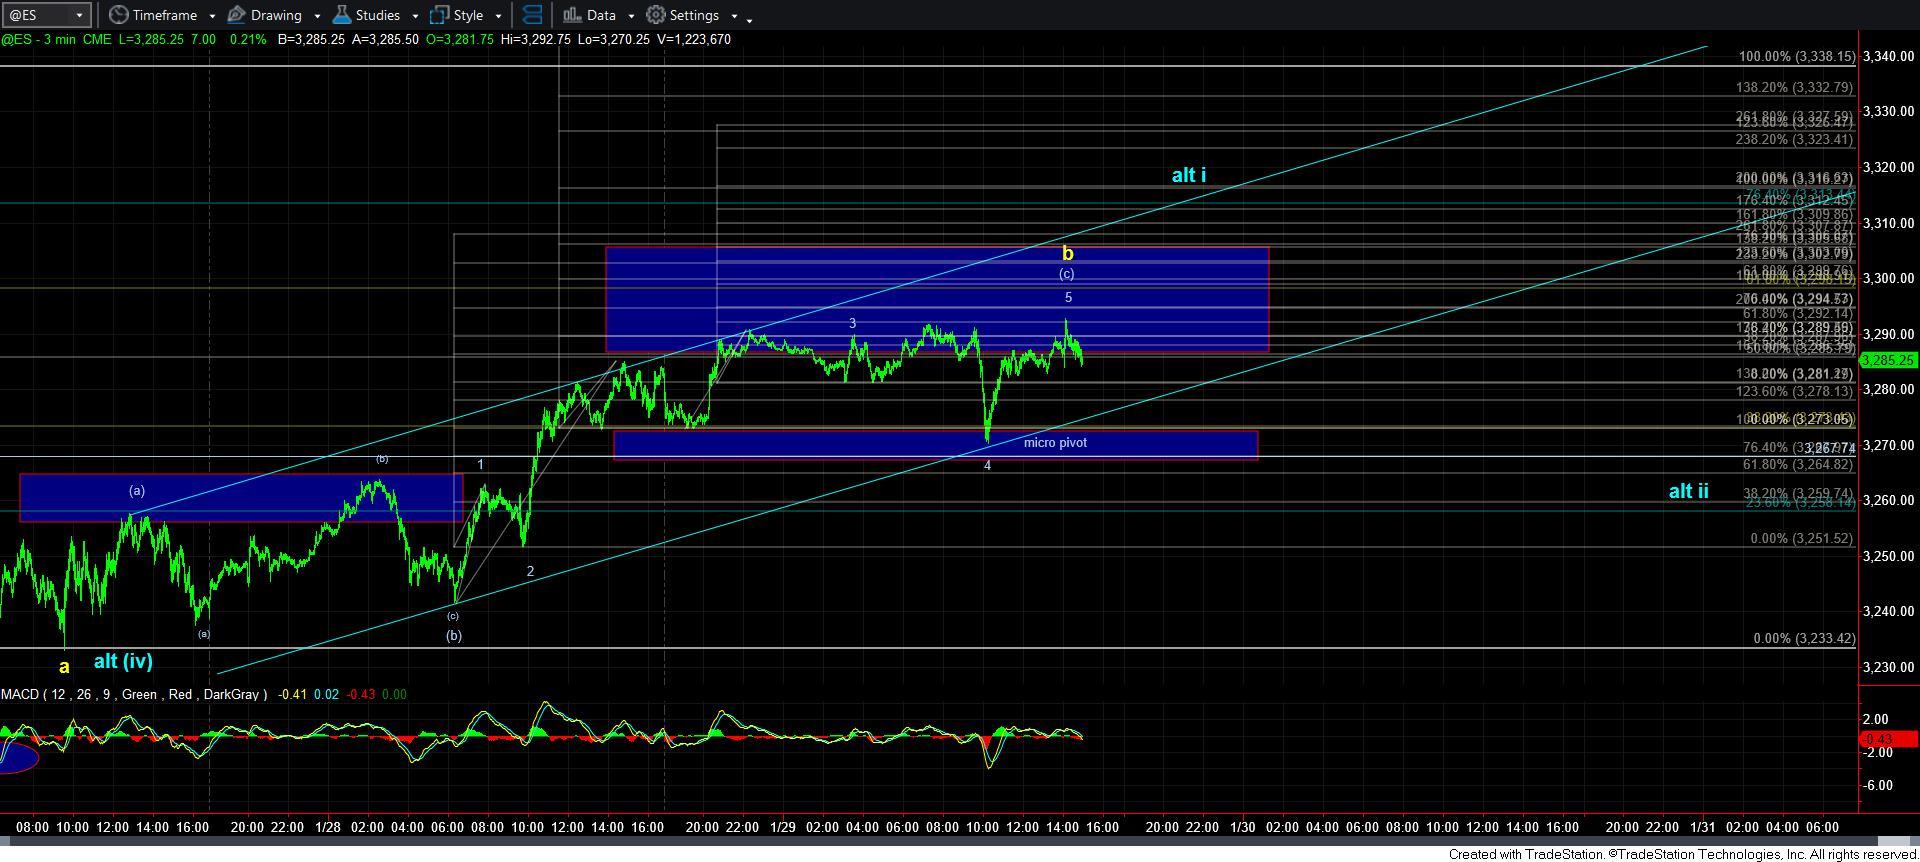
Pushing b-wave Limits Again
The market has tested our micro pivot twice now – once overnight, and once during the market hours – and has held to push higher. At this point in time, we have come into the standard retracement region for a b-wave in the .618 retracement region of the prior decline. So, we have a full pattern in SPX, and we have struck the ideal target region.
Yet, this market has been extremely strong, so we cannot assume we are dropping in a c-wave to levels below 3200 until we see an impulsive 5-wave structure breaking us down below that pivot region.
To this end, I wrote the following update early this morning:
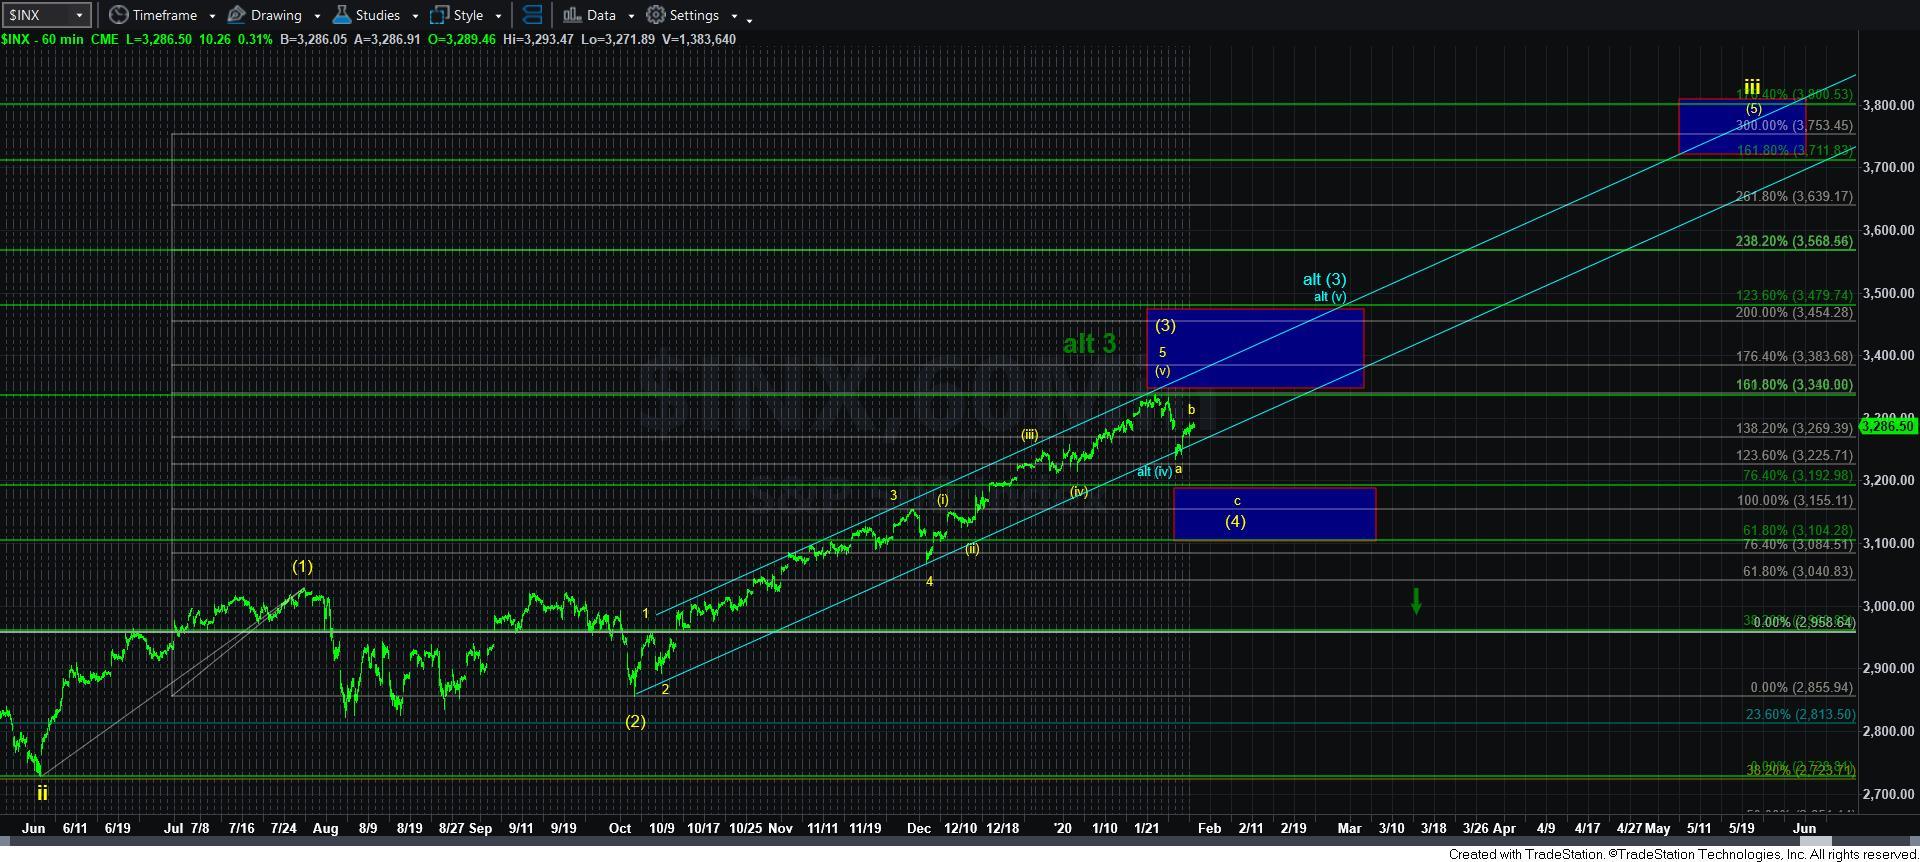
“We are now at another crossroad. If this is truly a b-wave within wave (4), as shown on the 60 minute chart in yellow, then we will have to be topping in this region. However, if we continue higher, then I am going to consider the alternative that wave (iv) of 3 is what we just completed, as presented in blue, and if we see a corrective pullback, and then break out over the higher we strike for alt wave i in blue, then it will be pointing us up towards the 3450-3500 region for a more extended wave (3) of iii.
For now, this is simply an alternative. But, if we continue much higher, this alternative begins to gain some weight. Right now, I am looking for the topping in the b-wave, with an impulsive decline below 3273ES supporting that perspective.
The ramifications of the alternative is that we will likely see wave (4) later in the early spring, and bring us back to the 3200SPX region. Remember, if the (3) of iii strikes the 1.236 extension, the (4) of iii usually comes back to the .764 extension, which is the 3200 region.”
So, if the market is able to move higher into tomorrow, then it will make the blue count something we have to watch for much more carefully. That would mean that if the next decline would take shape correctively, and then we rally over the high we strike over 3300, it would likely put us on a course to target the higher wave [3] of iii target, as shown on the 60 minute chart.
However, if we can begin an impulsive structure to break below the micro pivot on our 5-minute ES chart, then we have an initial indication that the c-wave down is taking hold, and will likely target levels below 3200SPX.
Its time for another decision by Mr. Market. Ultimately, the bigger picture still has me viewing the larger degree chart as bullish as long as we remain over 3100SPX.