Pushing Up Into Resistance
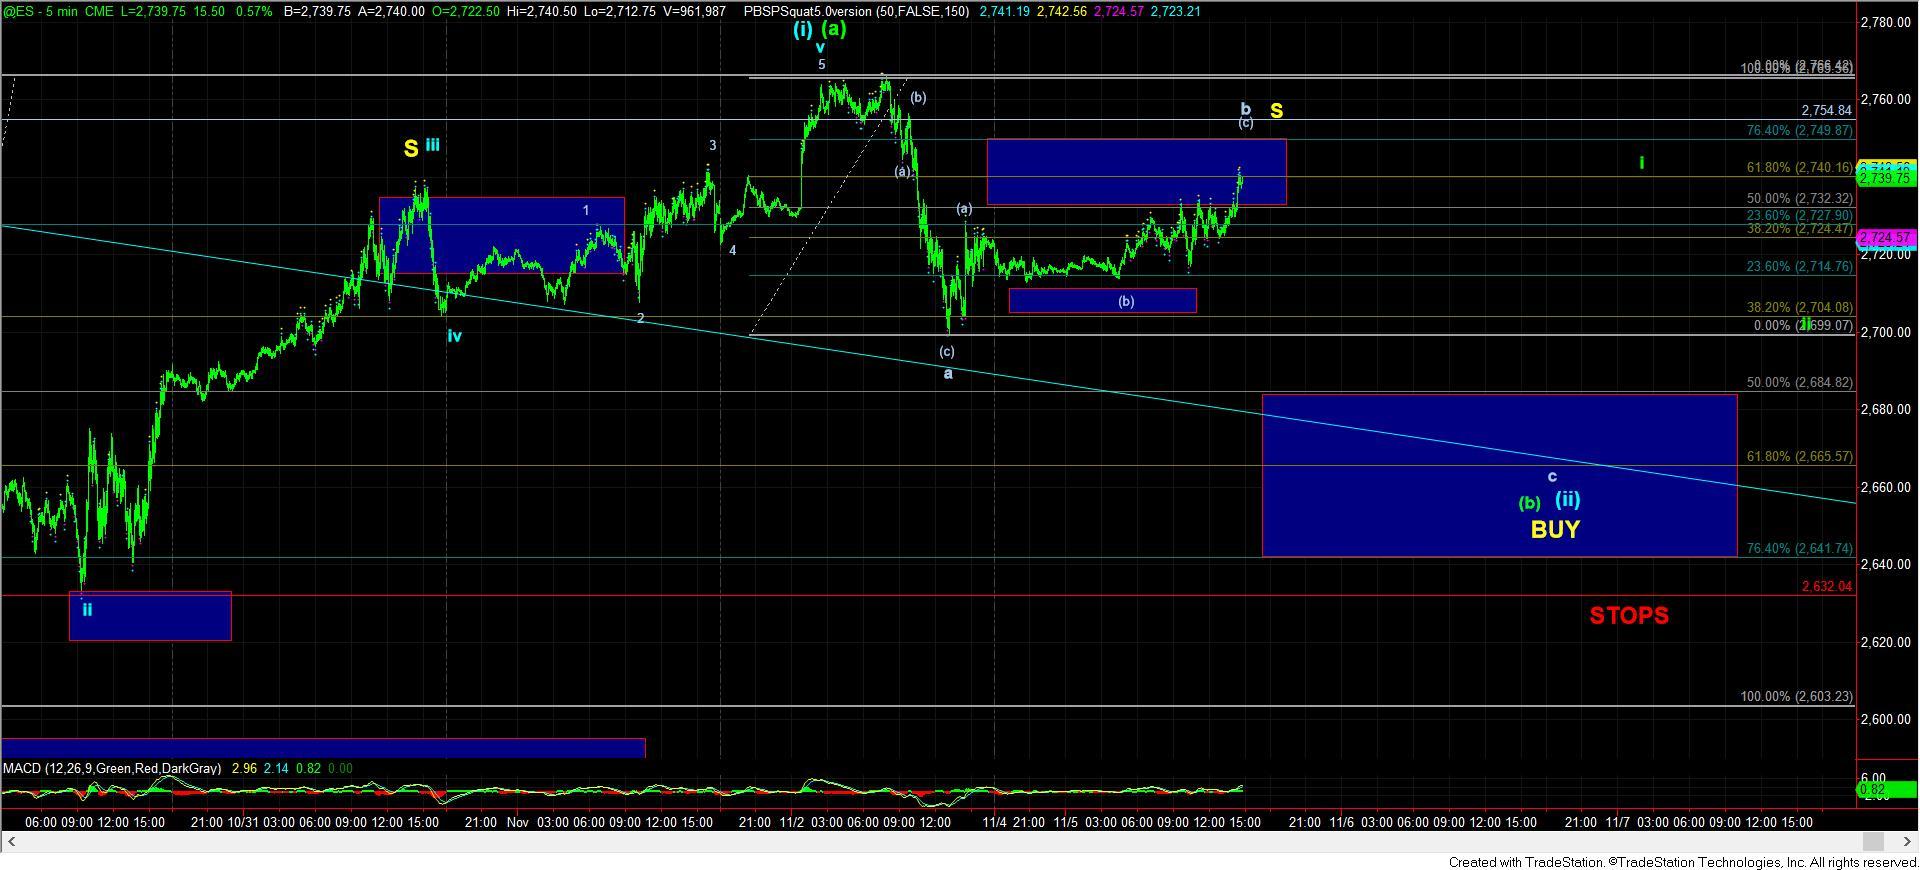
With the ES spending its time completing the (b) wave into Sunday night, today we continued higher in the (c) wave of the b-wave we have on the chart. As of my writing this, the market has reached the .618 retracement of the initial a-wave drop in the green (b) wave. However, the ES may very well extend up towards the higher end of the box to complete the (c) wave of this b-wave rally.
Breaking back down below 2724ES would be the initial indication that we are dropping in the c-wave of the green (b) wave. And, as long as we remain below 2755ES, I am expecting this rally to set up the decline in the c-wave of the green (b) wave.
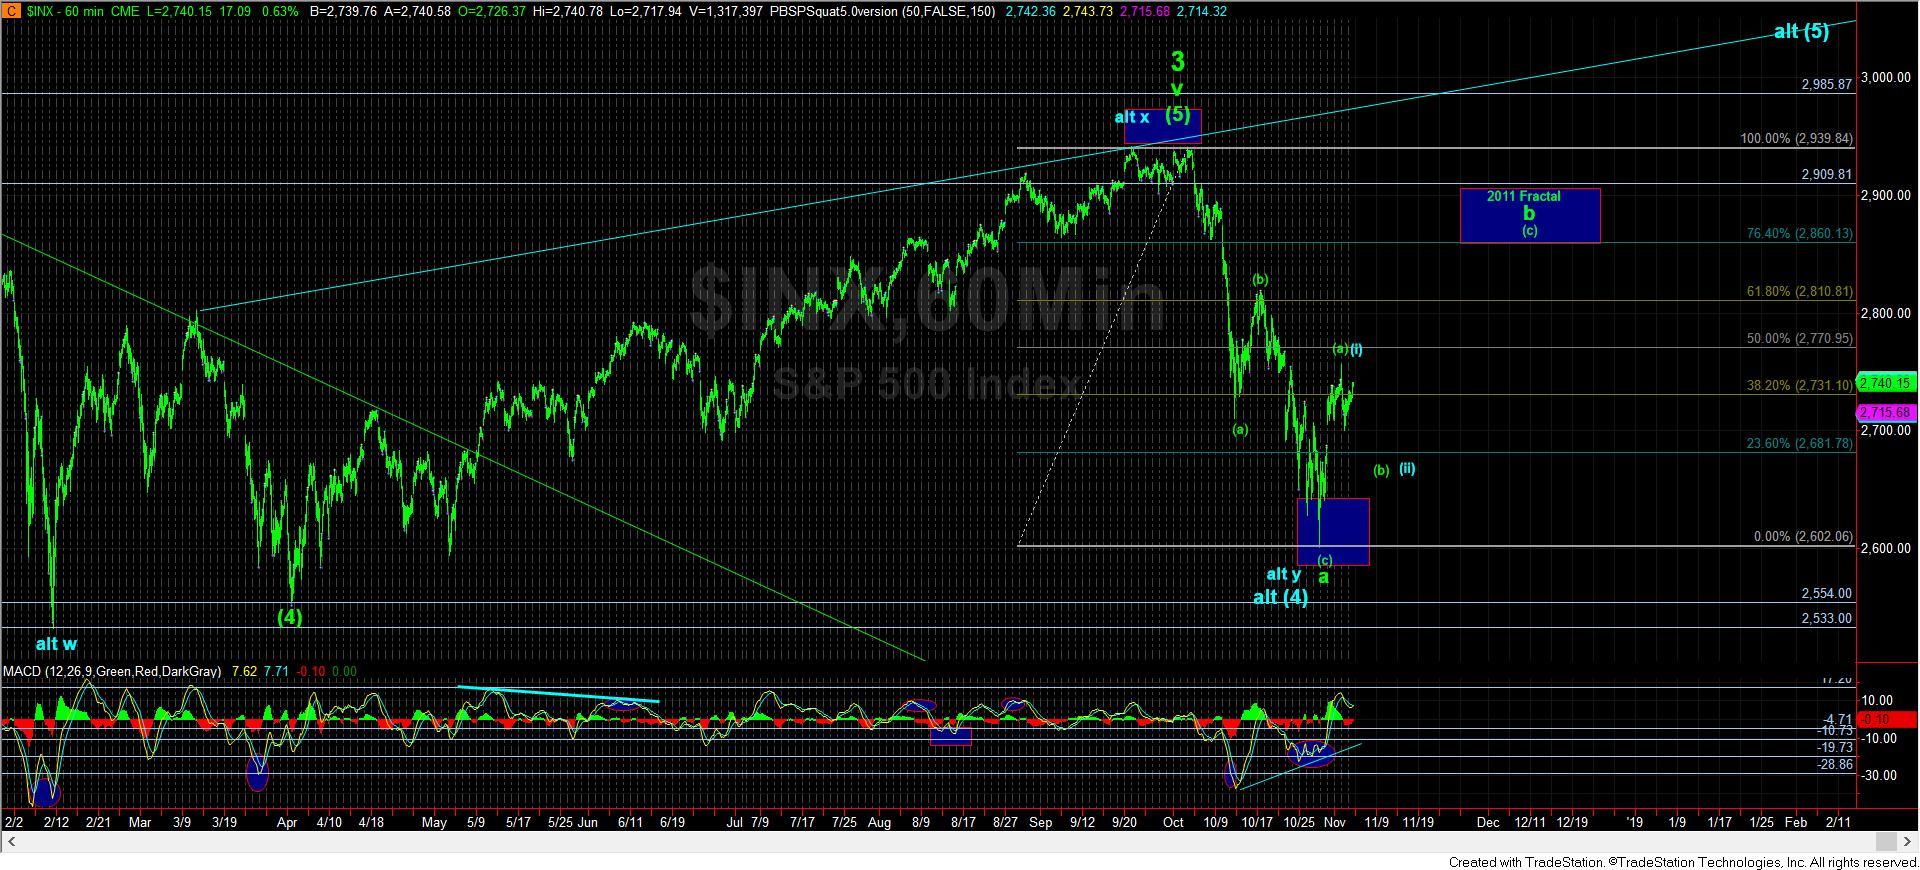
Ultimately, I am still expecting the market to take us to at least the 2820SPX region, and potentially up towards the blue box I have on the 60-minute chat in the 2860-2910SPX region in the coming weeks. However, that also suggests that any drop in the c-wave of the green (b) wave should hold the 2640ES support region below.
Once the market completes this (c) wave in the b-wave rally on the 5-minute ES chart, we can begin to identify the higher probability targets within the blue support box below. And, again, as long as we remain below 2755ES, that would likely be setting up for tomorrow.
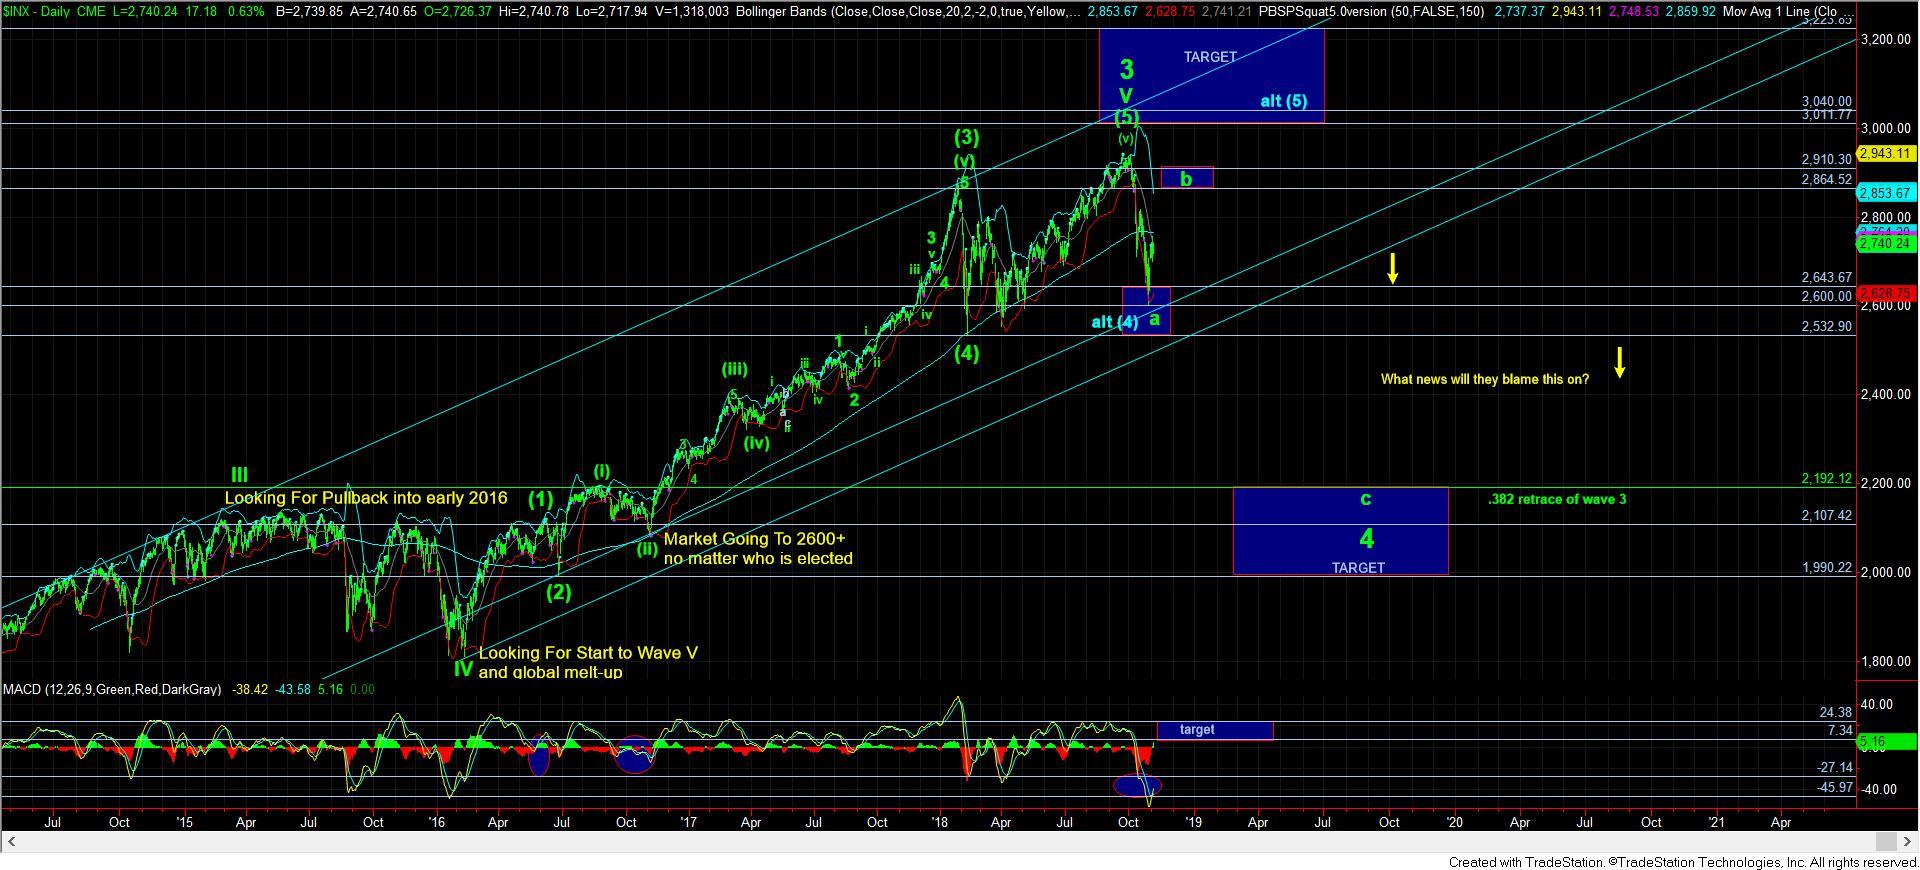
In the bigger picture on the daily SPX chart, I still need to see the MACD move much higher in the coming weeks to set up the c-wave decline to the downside. So, I do not think we are ready for a sizeable decline just yet, and will continue looking higher as long as support continues to hold.