Pullbacks Are Still Quite Within Reason – But Know Where Melt-up Takes Hold
I want to try to summarize my larger degree thoughts into this update -which I reviewed in my live video this morning- so everyone can be clear of my perspective at this time. If you have not heard my live video from this morning, I STRONGLY urge you to listen to it as I made my thoughts quite clear.
First, I view the market as setting up for a very strong rally into 2021. The underlying stocks within the market are set up quite bullishly, which supports our expectations for 2021.
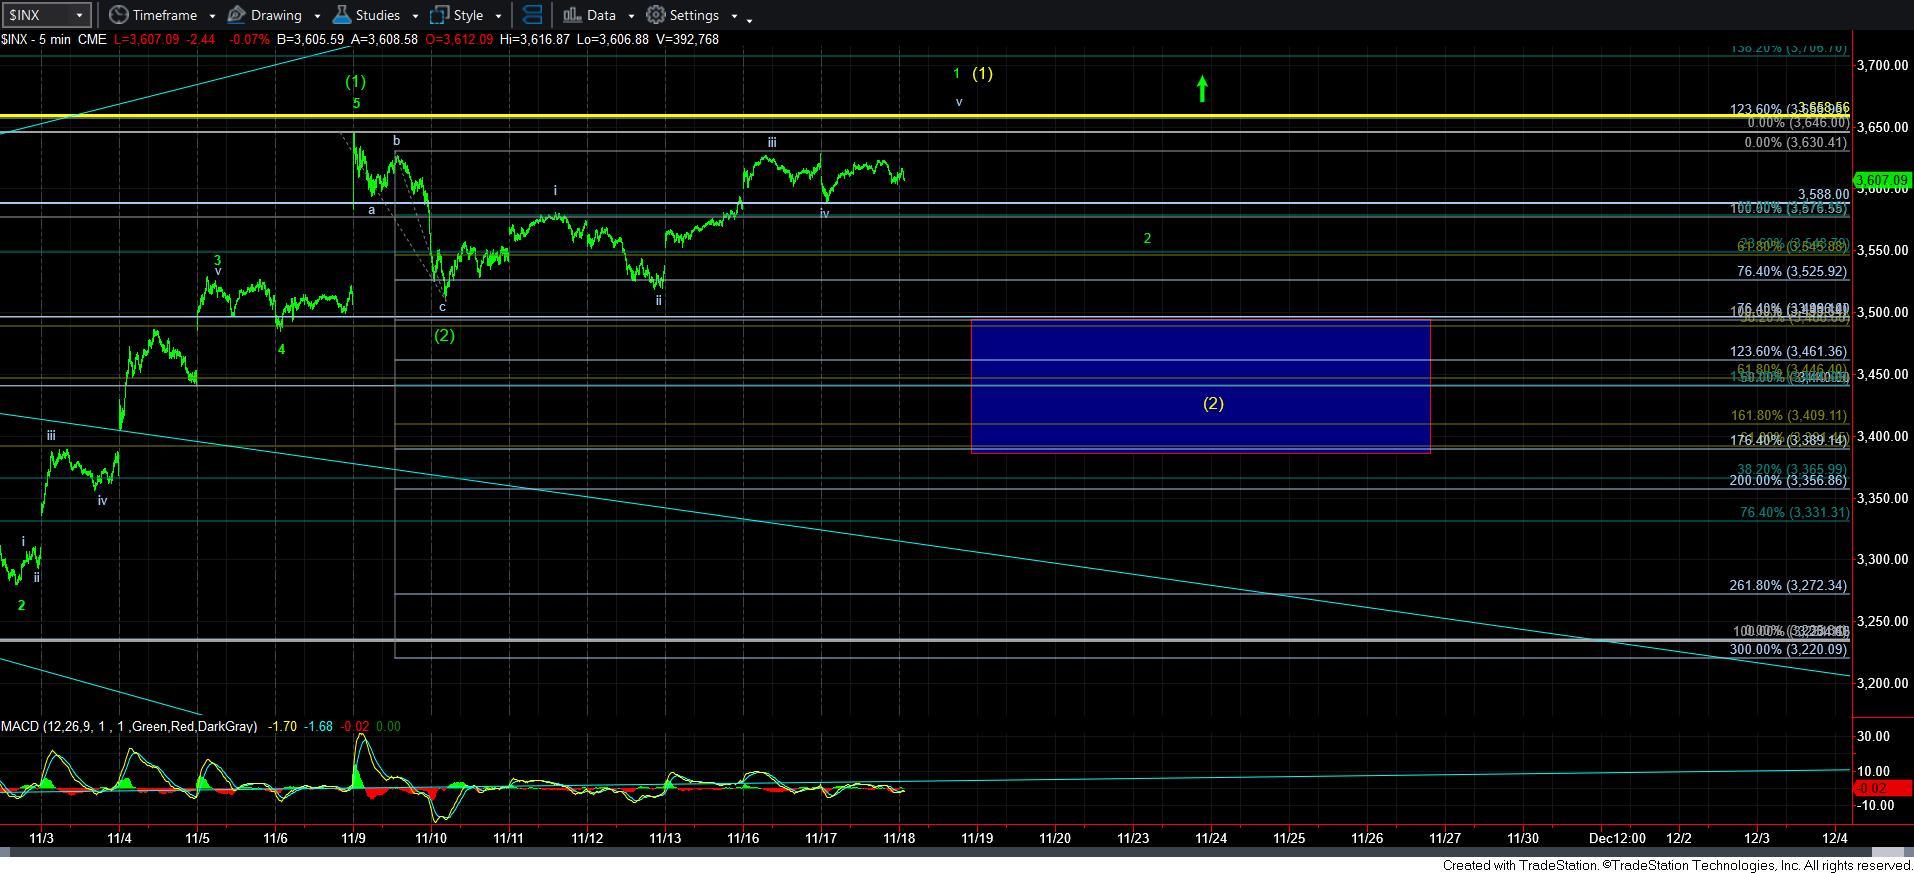
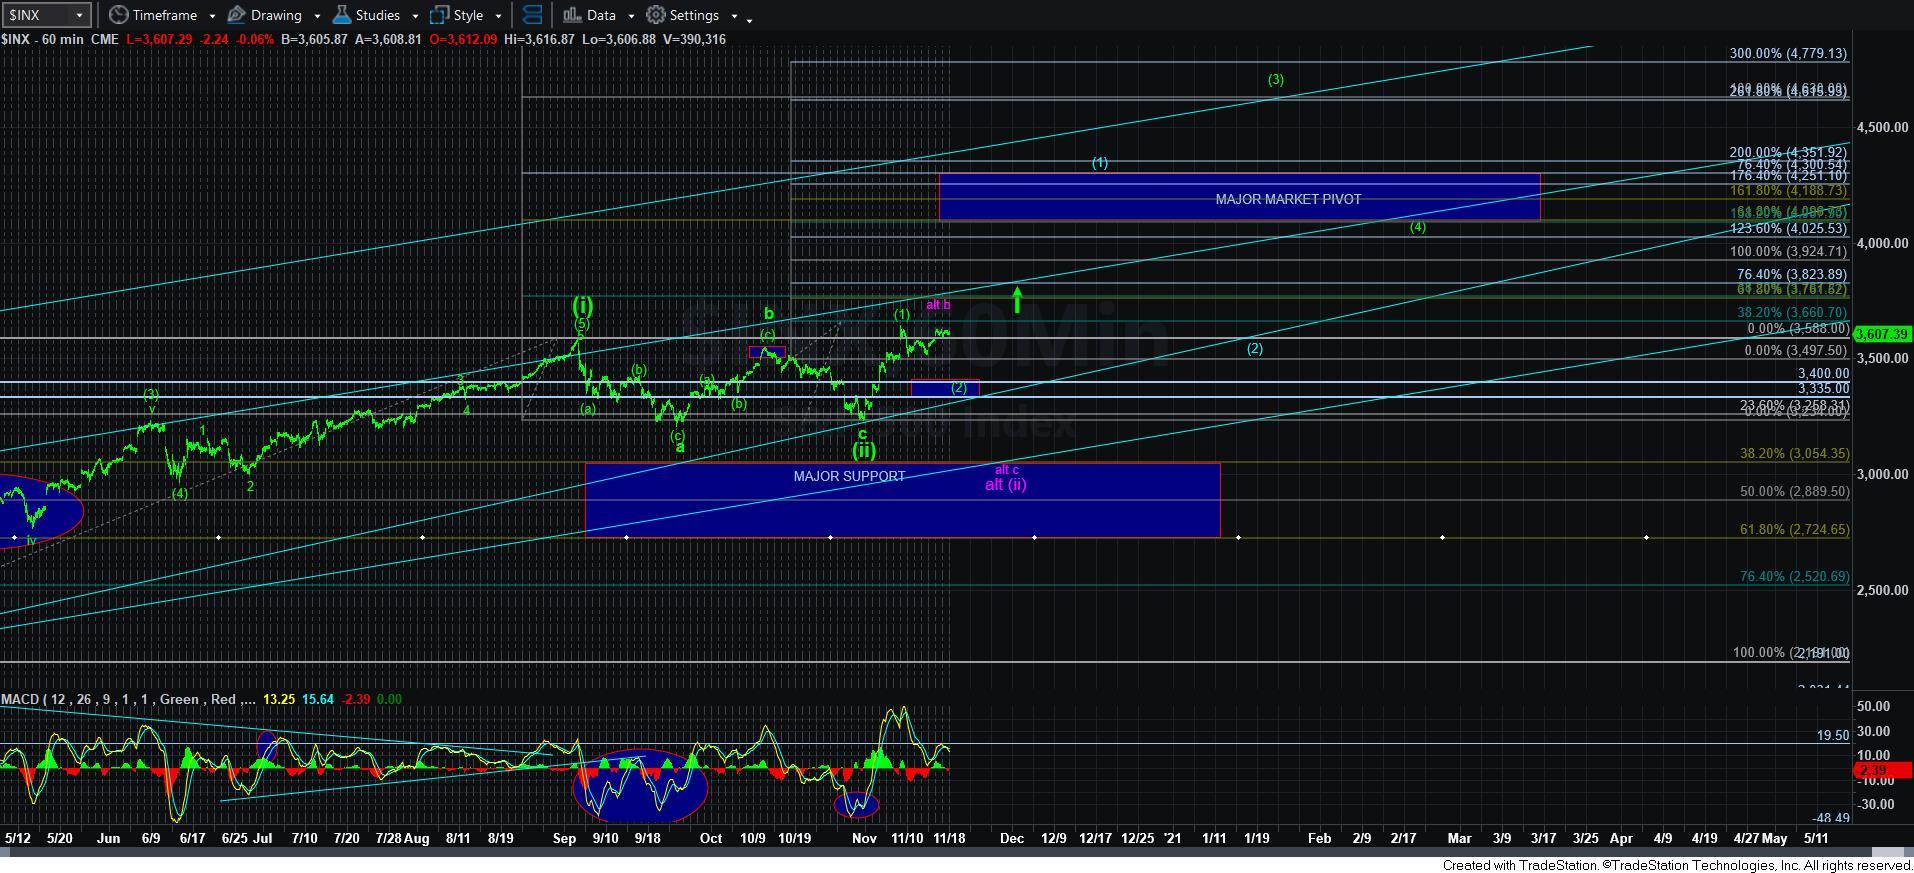
Second, the only question with which we have been grappling now for the last several weeks is where the heart of the 3rd wave will take hold to 4000+.
Third, until the heart of the 3rd wave actually takes hold, I have to strongly consider a bigger pullback can potentially still happen due to the structure I am seeing in the NQ chart.
Those three bullet points above succinctly explain my overall perspective about the equity market. You see, when a market sets up bullishly, it can take off well before it provides us with a standard pullback structure for a 2nd wave in a minority of circumstances. It does not happen often, but when we are reasonably set up for the heart of a 3rd wave to potentially break out, we must recognize that potential and act once it does trigger.
So, at this time, the market is providing us with indications that it MAY trigger a lot earlier than I had expected months ago and from a much shallower pullback that I expected. It is for this reason that I have been tracking the more immediate break out potential so closely, even though my preference has been to see more of a retrace.
But, to be brutally honest, a bigger pullback – even a bigger c-wave in wave [ii] presented in purple on the 60 minute chart - is still very much alive until the [i][ii][1][2]1-2 structure triggers us to the upside for a direct move to 4200-4300SPX.
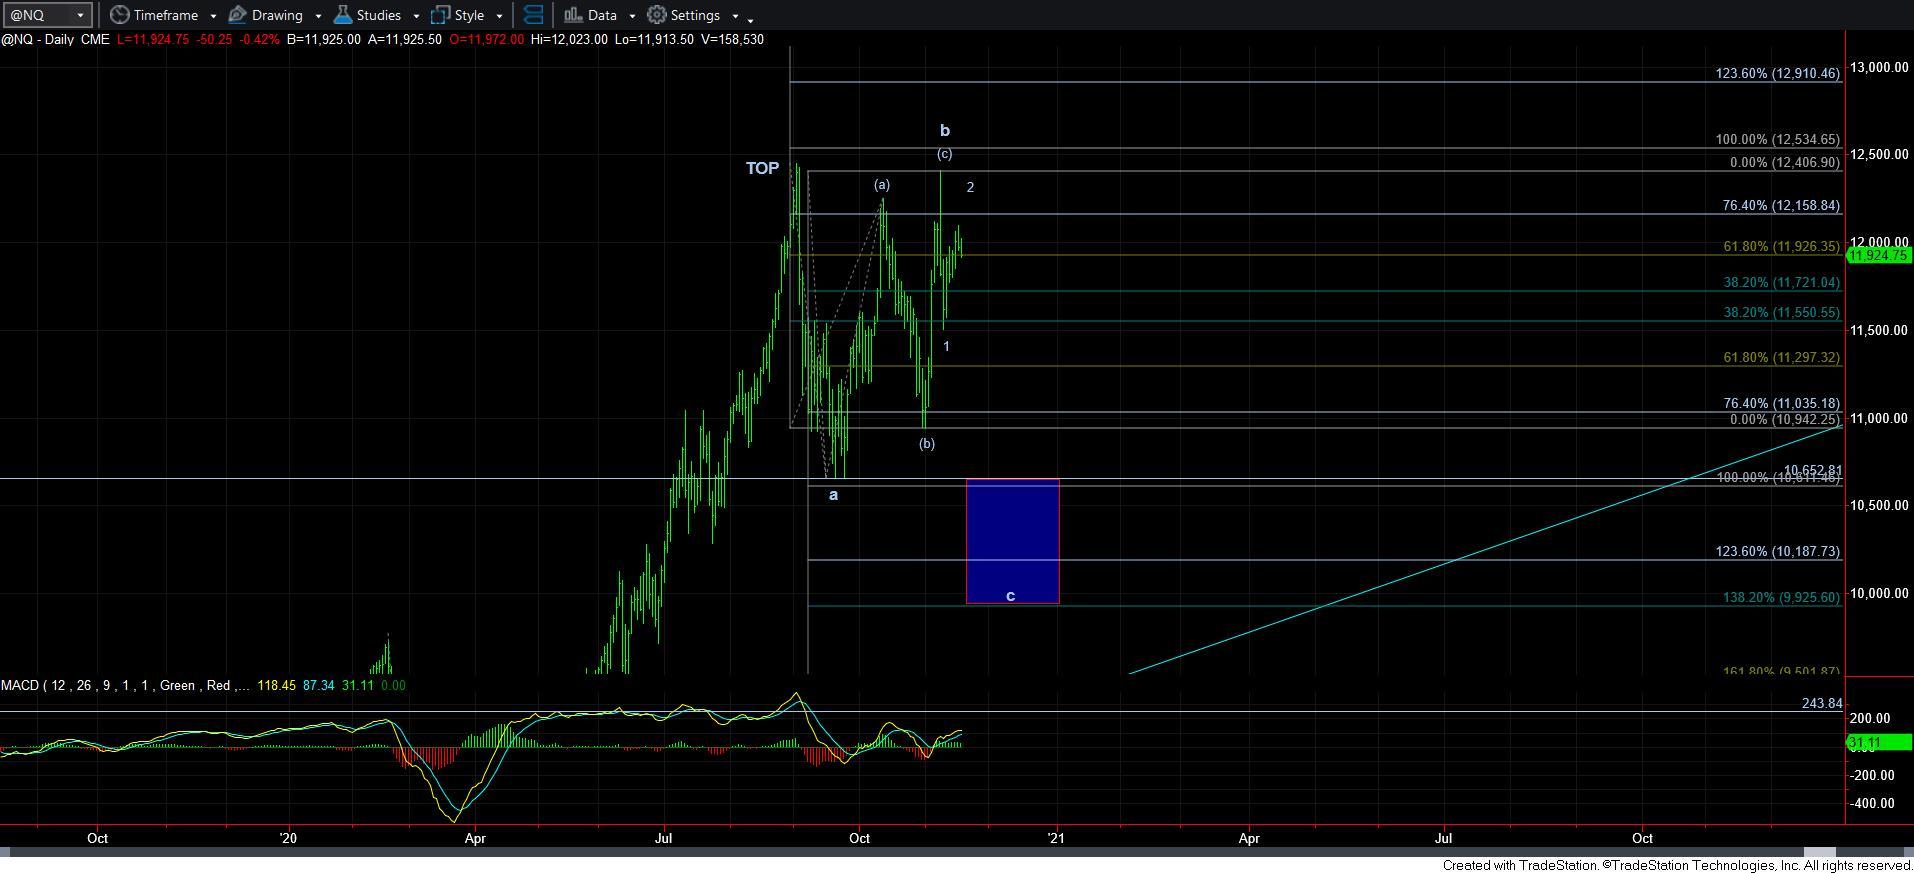
As I outlined in my live video today, the current shown wave [ii] is less than ideal since it is unusually shallow, and the c-wave within that structure really did not complete a standard and clear 5-wave structure. Moreover, the NQ chart is still pointing to a larger degree c-wave decline potential for as long as it remains below 12,409. However, I would need to see an impulsive break down below 3335SPX to suggest that the same pattern is playing out in the SPX and pointing us again to the 3050SPX potential. But, should we see an impulsive break down below 3335SPX, it opens the door to actually target the wave [ii] target box I have had on our 60-minute chart for months.
So, to summarize my live video from this morning, even if the market is able to reach the 3660SPX region over the coming day or so, I still see a reasonable probability for a bigger pullback in at least the yellow wave [2] UNLESS the market provides us with a more shallow corrective pullback in the green wave 2 on the 5-minute SPX chart, with a breakout thereafter over the high we strike in the 3660SPX region. Only THEN will I view the direct break out to 4200-4300SPX region as the immediate higher probability potential. And, until that [i][ii][1][2]1-2 break out actually triggers, I am still going to be looking for a pullback, and view that probability as quite reasonable.
Lastly, to put all of this into a risk/reward perspective, we have about 70-100 points of overhead resistance before we are likely in an immediate melt-up rally to 4200/4300SPX, and we still have “some” potential for a drop to as deep as 3050SPX, with the 3335-3450SPX being our main region of upper support.