Pullback Underway - Market Analysis for May 25th, 2021
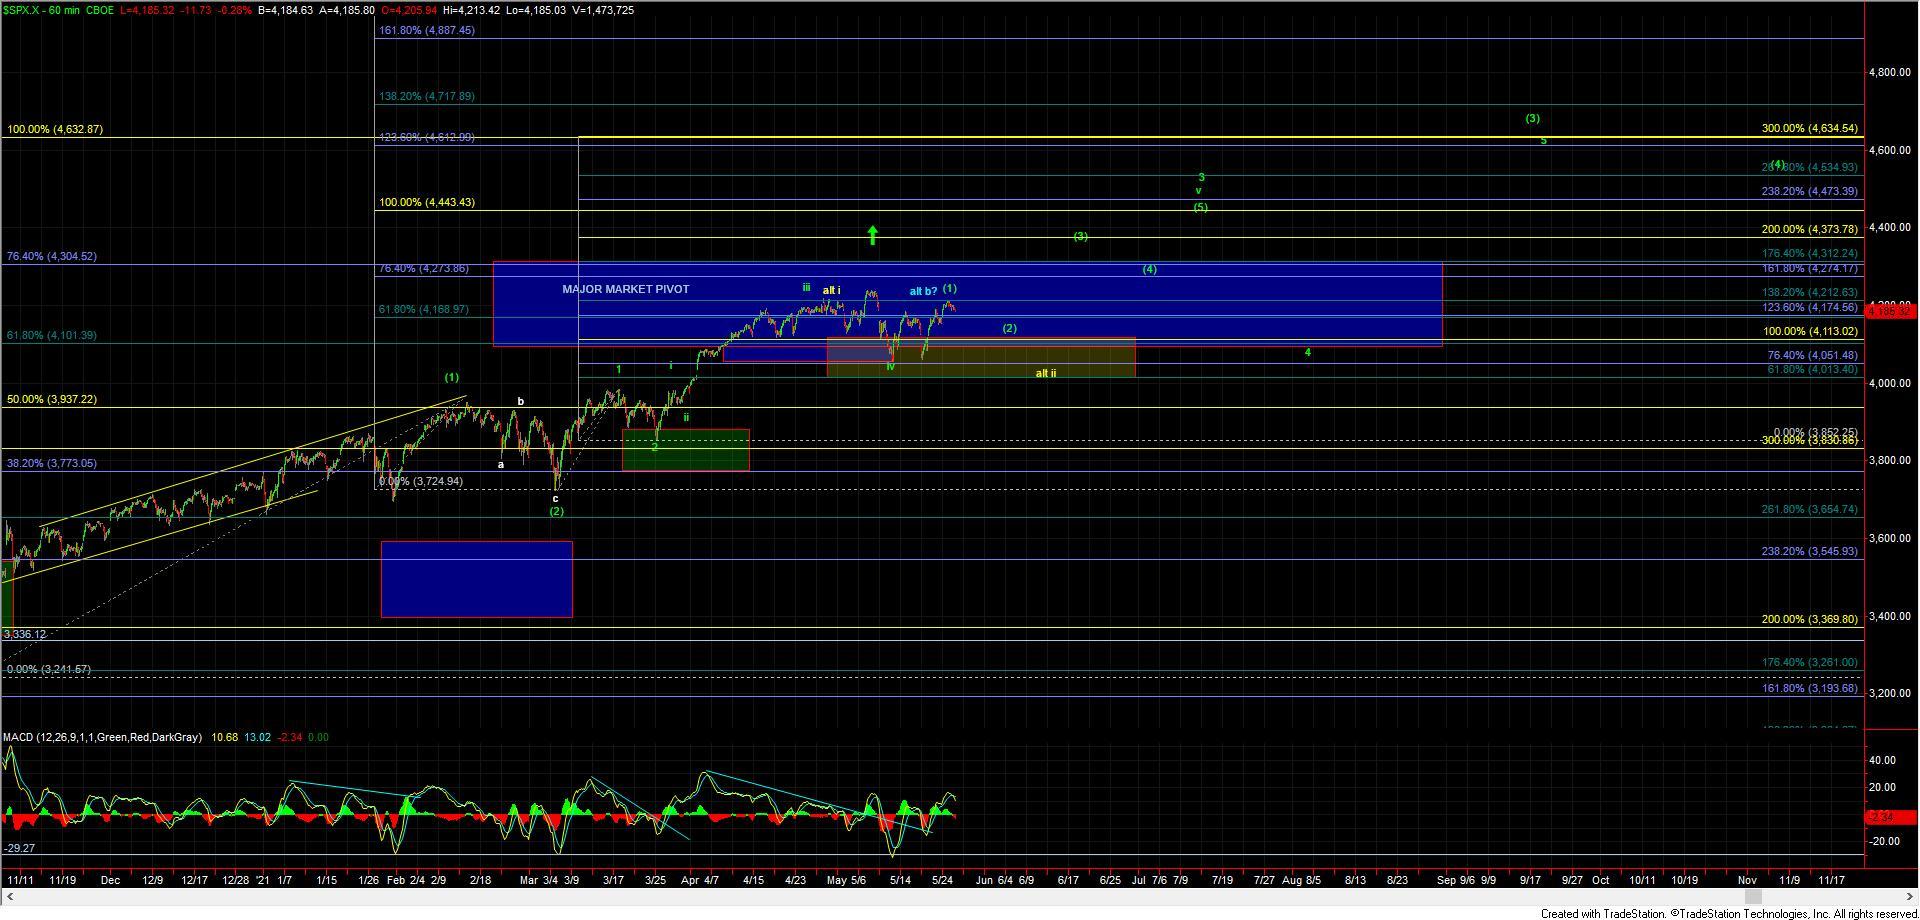
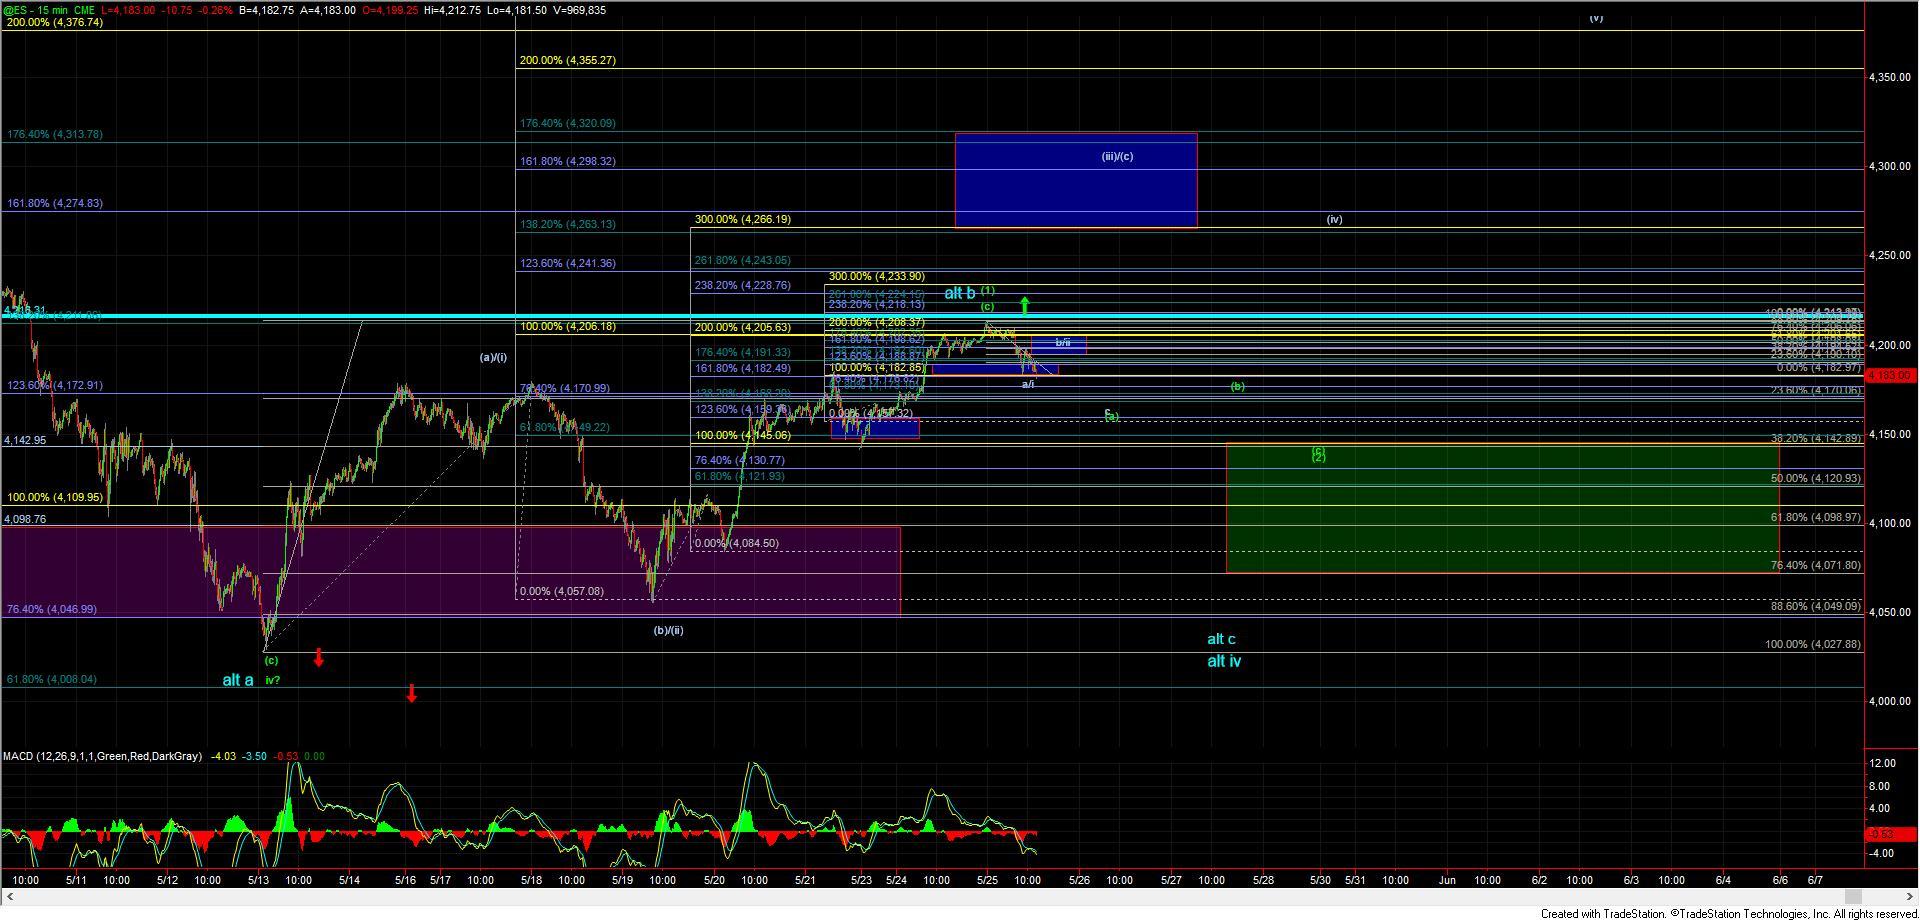
After striking a very key resistance level yesterday we saw the markets move lower failing to see a direct push through that key resistance level. Again this 4205/06 level was the 100ext of the initial move up off of the 4028 low. Whenever we see a failure very near to the 100 ext it usually a warning sign that the pattern is likely going to follow a larger corrective wave structure. In this particular case that corrective wave structure is likely part of a larger ending diagonal to the upside where we should be topping in a wave (1) of larger wave v which is shown in green on the charts.
So under this case, we would be looking for a deeper pullback for a wave (2) which ideally should hold in the 4142-4071 zone. As this pullback should take the form of a larger abc corrective pattern the exact path down into that zone is still a bit less certain but as long as that zone holds we still should ultimately see higher levels before breaking back below that 4027 low. Structurally the action to the downside is also counting better as corrective in nature which is also more supportive of the green path rather than this topping in the alternate blue wave b. So again while a deeper pullback is still likey in the cards as long as we can hold support then the primary path is still projecting higher before dropping to a new low below the 4027 level.
Finally, I want to note that if we are indeed going to follow an ending diagonal to the upside to fill out this wave v of 3 the action is going to take some unexpected twists and turns on the smaller degree timeframes. So with that caution is certainly warranted for those attempting to trade this action on the shorter timeframes as it is likely will be difficult and unreliable.


