Pullback Provides An Opportunity
 By
By
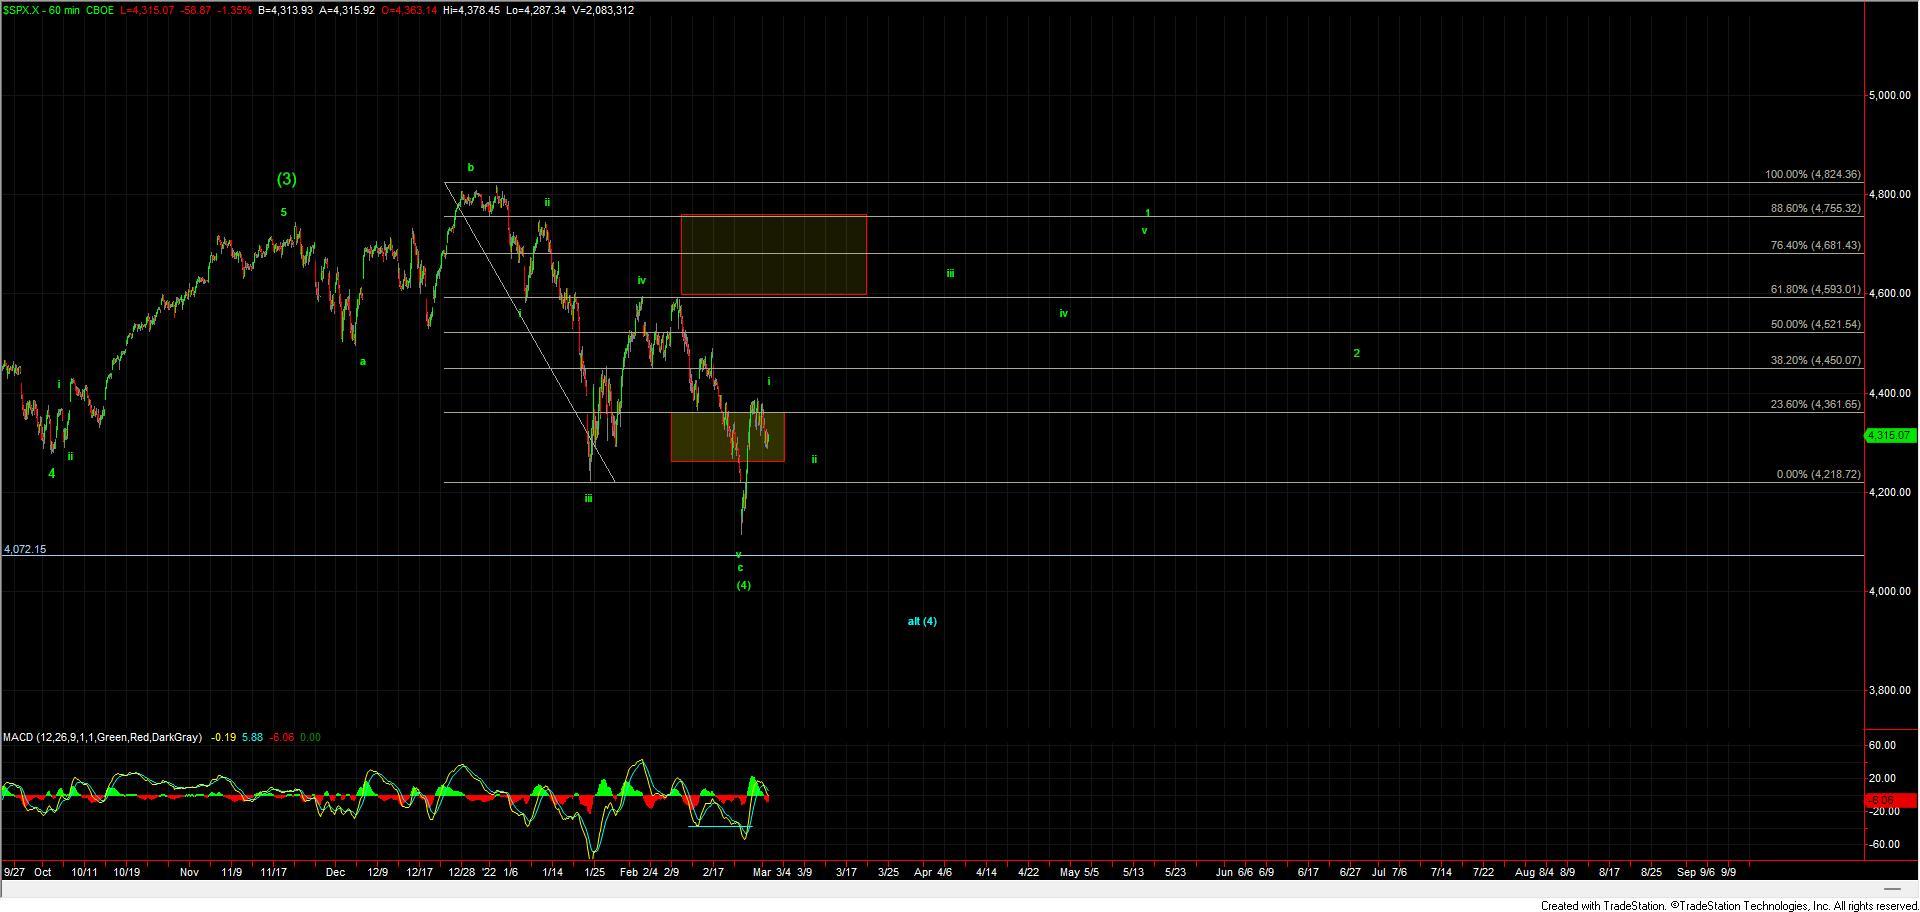
After seeing a very strong rally over the past several days today we saw the market finally turn lower and pull back towards the upper end of the support zone that we had been watching for the wave ii of the initial move up off of the lows. Furthermore, the initial move up off of the lows is certainly looking to take the shape of an impulsive five-wave move which has given us the initial signal that this very sloppy and ugly wave (4) has indeed completed. So from here, we are now looking for the wave ii to pull back into support followed by another smaller degree five wave move to the upside to signal that our wave iii is underway. So with that this move up off of the lows and pullback into support is providing us with an opportunity to buy equities for another push higher targeting back toward the previous all-time highs. Now I do want to note that we cannot fully rule out another push to new lows from here but this structure up off of the lows has made that prospect less probable and as long as we hold over support my base case will remain that a bottom has been struck for the green wave (4).
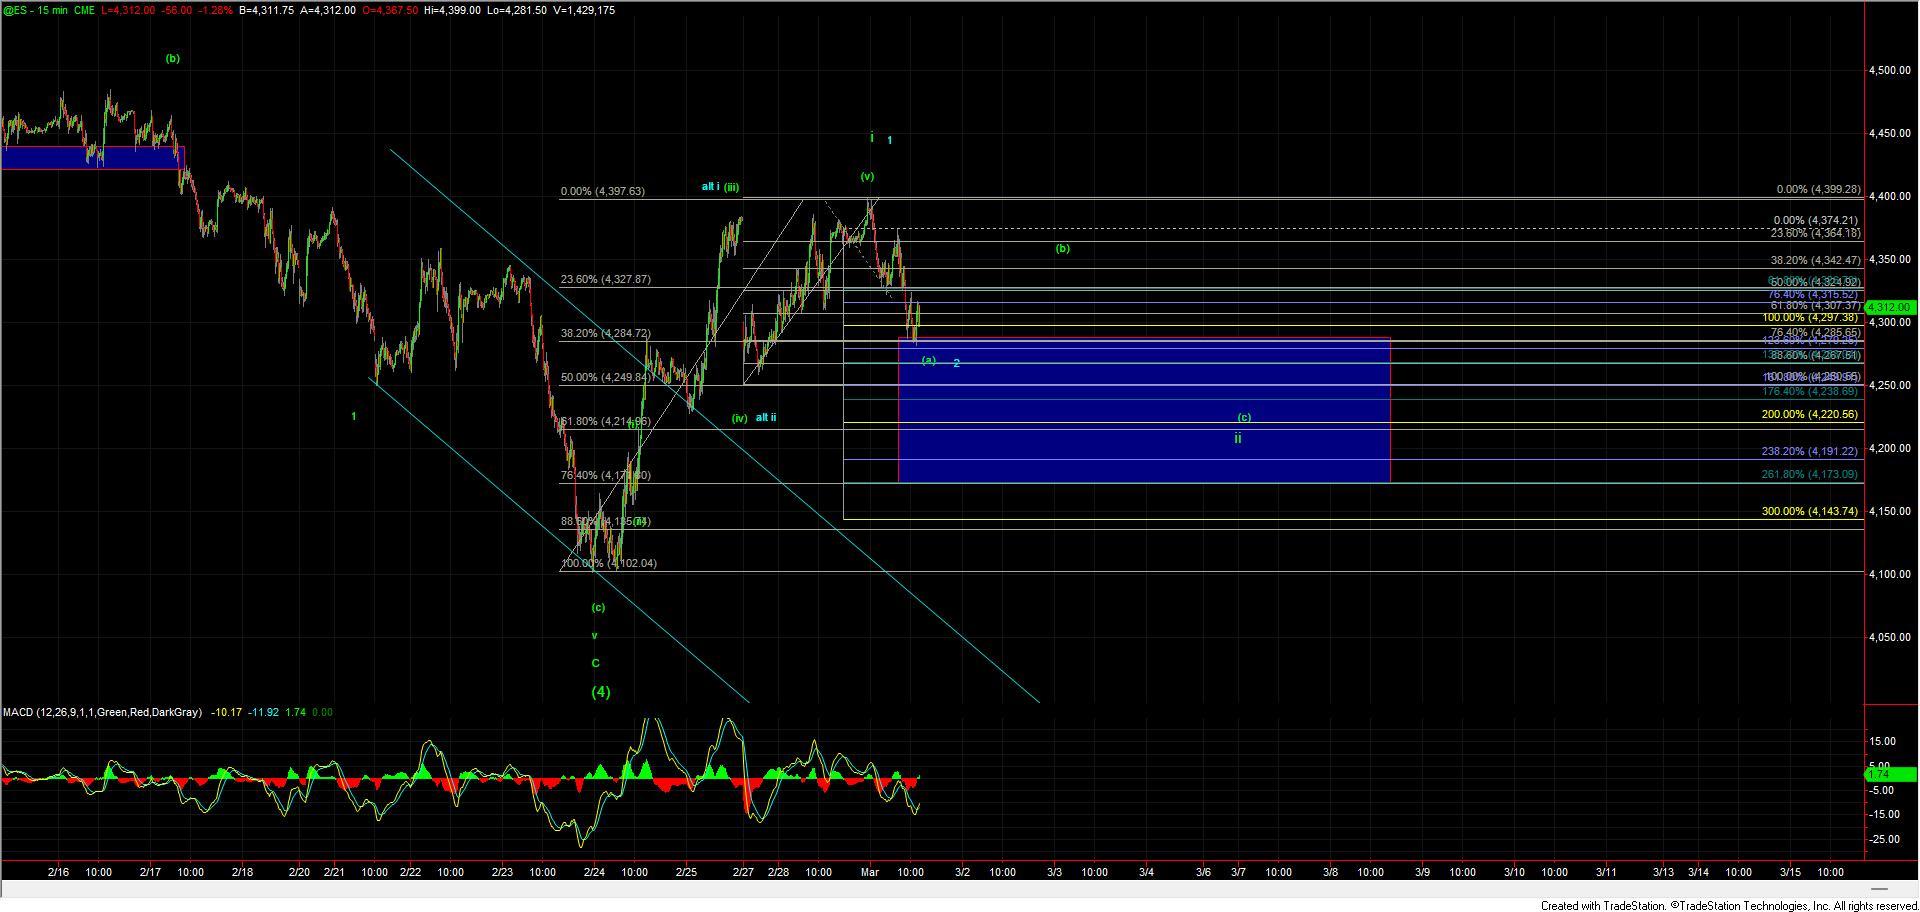
Zooming in a bit on that green count the retrace lower has currently hit the 38.2% retracement level of the entire move up off of the 4102 low. Along with being the upper end of the retrace level this is also a very common spot for the initial leg of the corrective move to see a bounce for a wave (b). In the afternoon session, we have seen a bounce at that level so far and we may just be getting that wave (b) of ii as we head into the final hour of trading. I do want to note however that corrective wave action can and often does take unexpected paths so I prefer to focus more on the support zone for the entire wave ii which currently resides in the 4285-4173 zone. I will be looking for a full five-wave move up off of one of the key fibs within that zone to give us an initial signal that the bottom of the wave ii has indeed been struck. Assuming that we can see that five-wave move we then would be looking for a push back up over the 4397 high to give us further confirmation that a bottom has indeed been struck From there we can then layout the larger pivots to the upside which we first would need to see where this finds an ultimate bottom in the wave ii. It is also a bit early to come up an accurate target zone for the wave iii of 1 off of the lows as we still need to see where wave ii bottoms but assuming the wave ii can bottom in the standard retrace range then I would be looking for the wave iii to target the 4600-4750 area with the ultimate wave v of the larger wave 1 targets being closer to the previous all-time highs.
So as I noted above, while a lower low cannot be ruled out completely the pattern that we have in place is certainly giving us a fairly high probability that the bottom is indeed in place. We can then use the parameters provided by the Elliott Wave count and fib support levels to define our risk on any new entries. Having these clearly defined parameters is extremely helpful in making tough decisions in entering the market, especially in the fact of what is very lkey to be more news that is "bad" for the market. We have of course seen this play out time and time again and the market very often bottoms well in advance of the "worst" news, making most market participants scratch their heads. With a probabilistic approach, however, there really is no head-scratching involved as we know our parameters ahead of time, and use those parameters to form a plan, the discipline comes of course sticking to that plan when the emotions run hot and the pundits start pounding.