Pullback In Progress - Market Analysis for Jan 25th, 2023
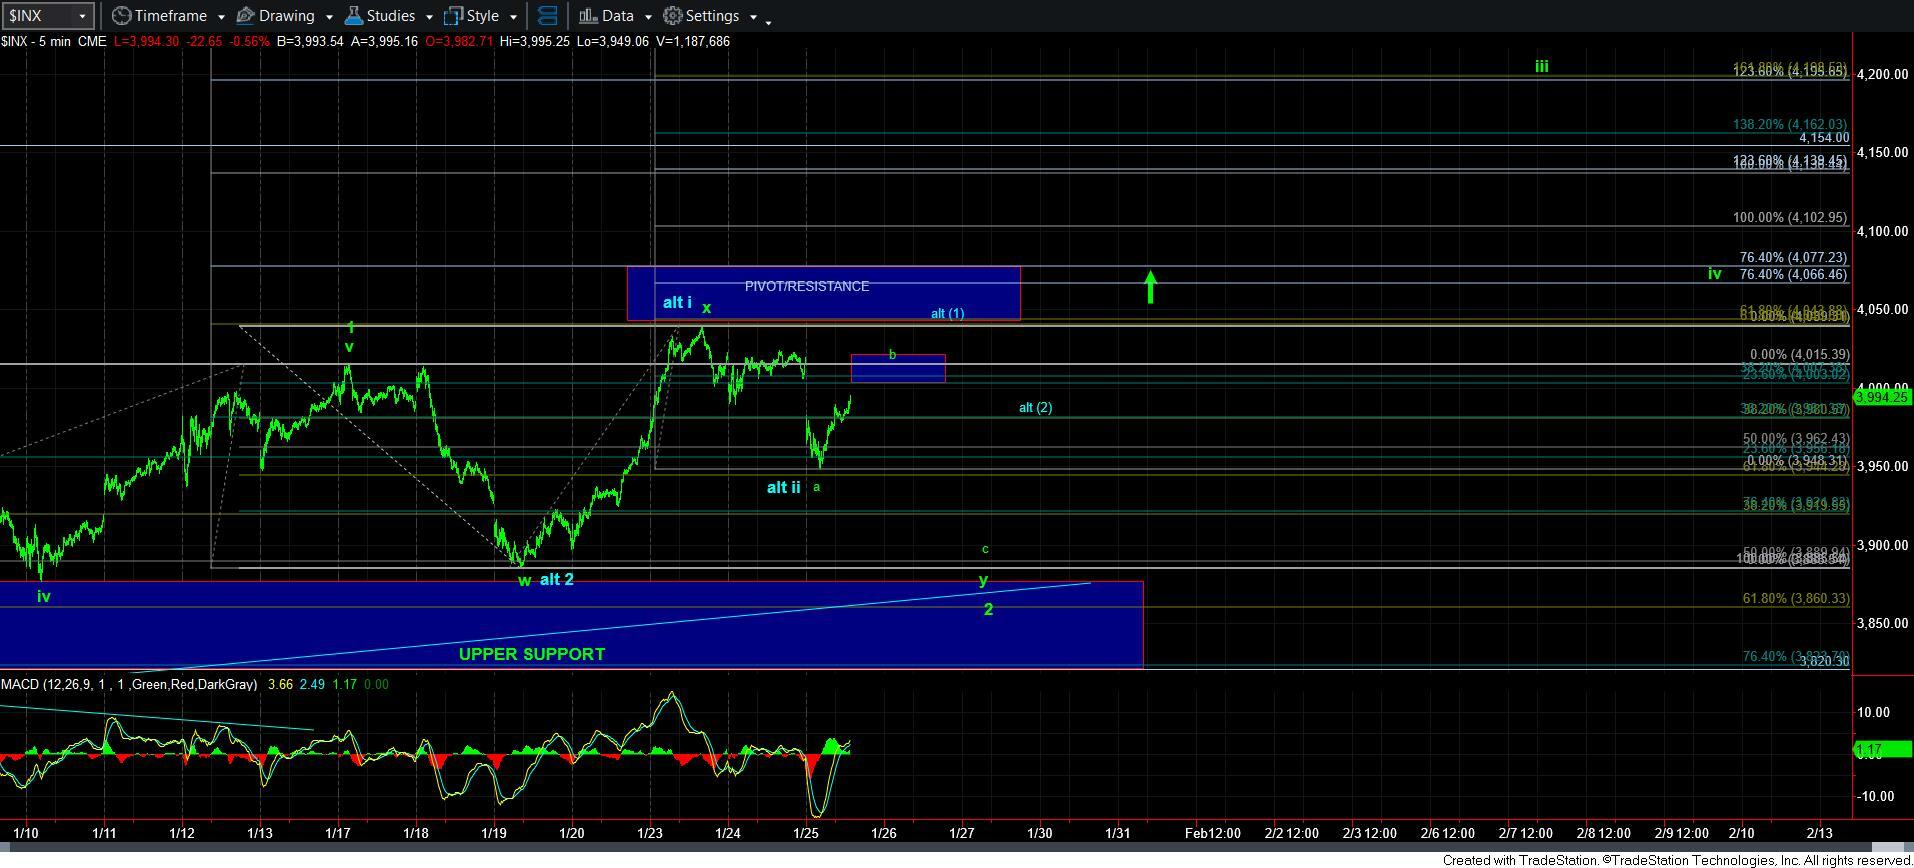
Well, we are certainly seeing the pullback of which I spoke about lately, as we have broken down below our upper micro support at 3985SPX. And I am still viewing this as being in progress of completing the wave 2 of the [c] wave. Yet, there is a slight problem.
Normally, c-waves are 5-wave structures. And, would you know it, this one is taking shape in 3-wave structures. This means that we are either tracing out an ending diagonal for the c-wave of wave 2, or that the market is taking shape as a more complex w-x-y structure, which I am now showing on the 5-minute SPX chart.
So, for now, I am still looking down.
However, as you know, I clearly have an alternative I am tracking. As I noted earlier this week, while the SPX does not count well as a 5-wave rally into this week’s high, the ES certainly does have a very reasonable 5-wave rally structure. That would consider this week’s high as wave i of 3, and this pullback as wave ii of 3.
Clearly, this pattern is going to have to prove it to me for me to adopt it as a primary count. So, how does that happen?
Early this morning, I noted that I was calculating a support which provides us with 3 points of confluence for a more immediate bullish resolution. The 3944SPX region is where the .618 retracement of wave i resides, which also coincides with the point at which wave iii of 3 would target the 1.236 extension of waves 1 and 2, and where the 1.618 extension of waves i-ii resides. And, should we bottom in the 3944SPX region, then it would point us to the 4195SPX region for wave iii of 3 in the more immediate bullish case.
Today, we have thus far bottomed at 3949. Moreover, the market does look like it is tracing out an impulsive move up off that low.
What we also know is that wave [1] of iii often targets the .382-.618 extension of waves i-ii. That points us to the 4007-4043SPX region. So, if we see a clear 5-wave structure taking us into that region, followed by a corrective wave [2], and we then break out over this week’s high, that will make it likely that we are in wave [3] of iii, with all of wave iii pointing us to the 4195SPX region.
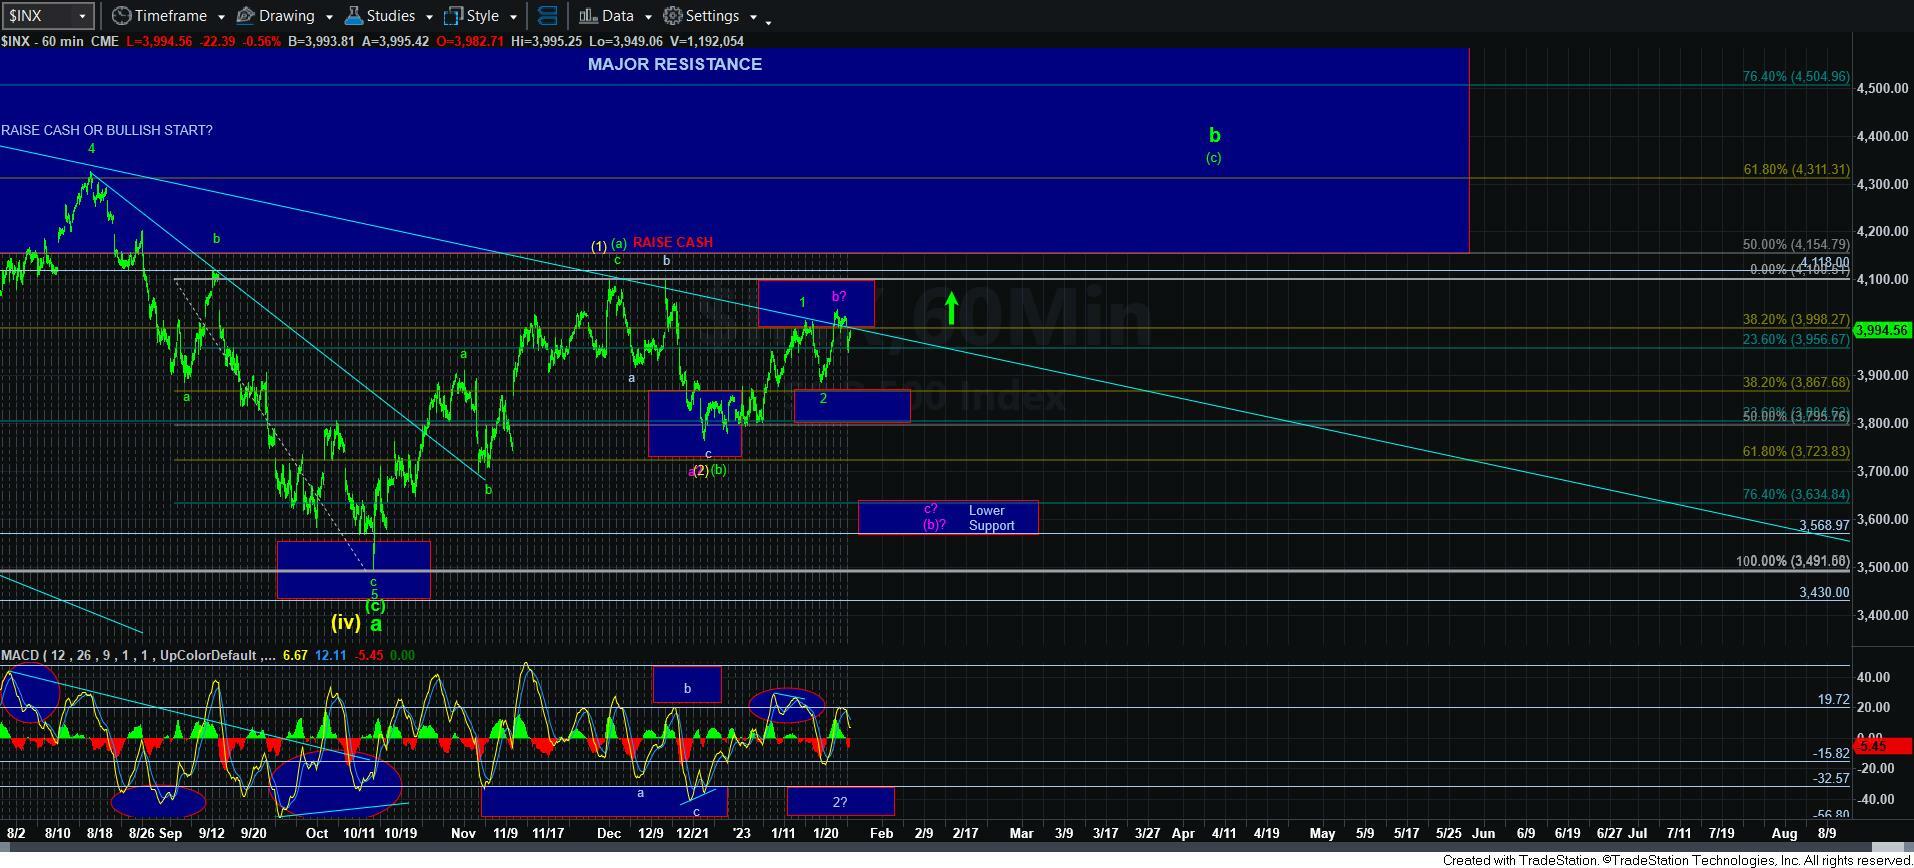
So, for now, I intend on remaining somewhat protective until the market proves otherwise. And, I have just outlined to you how the market can prove otherwise. And, lastly, until we actually break out, I will still "consider" the purple count on the 60-minute chart. But, as it stands right now, I have no set ups suggesting it plays out.