Pullback In Progress - Market Analysis for Oct 13th, 2020
With the market pulling back from yesterday’s high, the question we will need to answer over the coming days is what does this pullback represent?
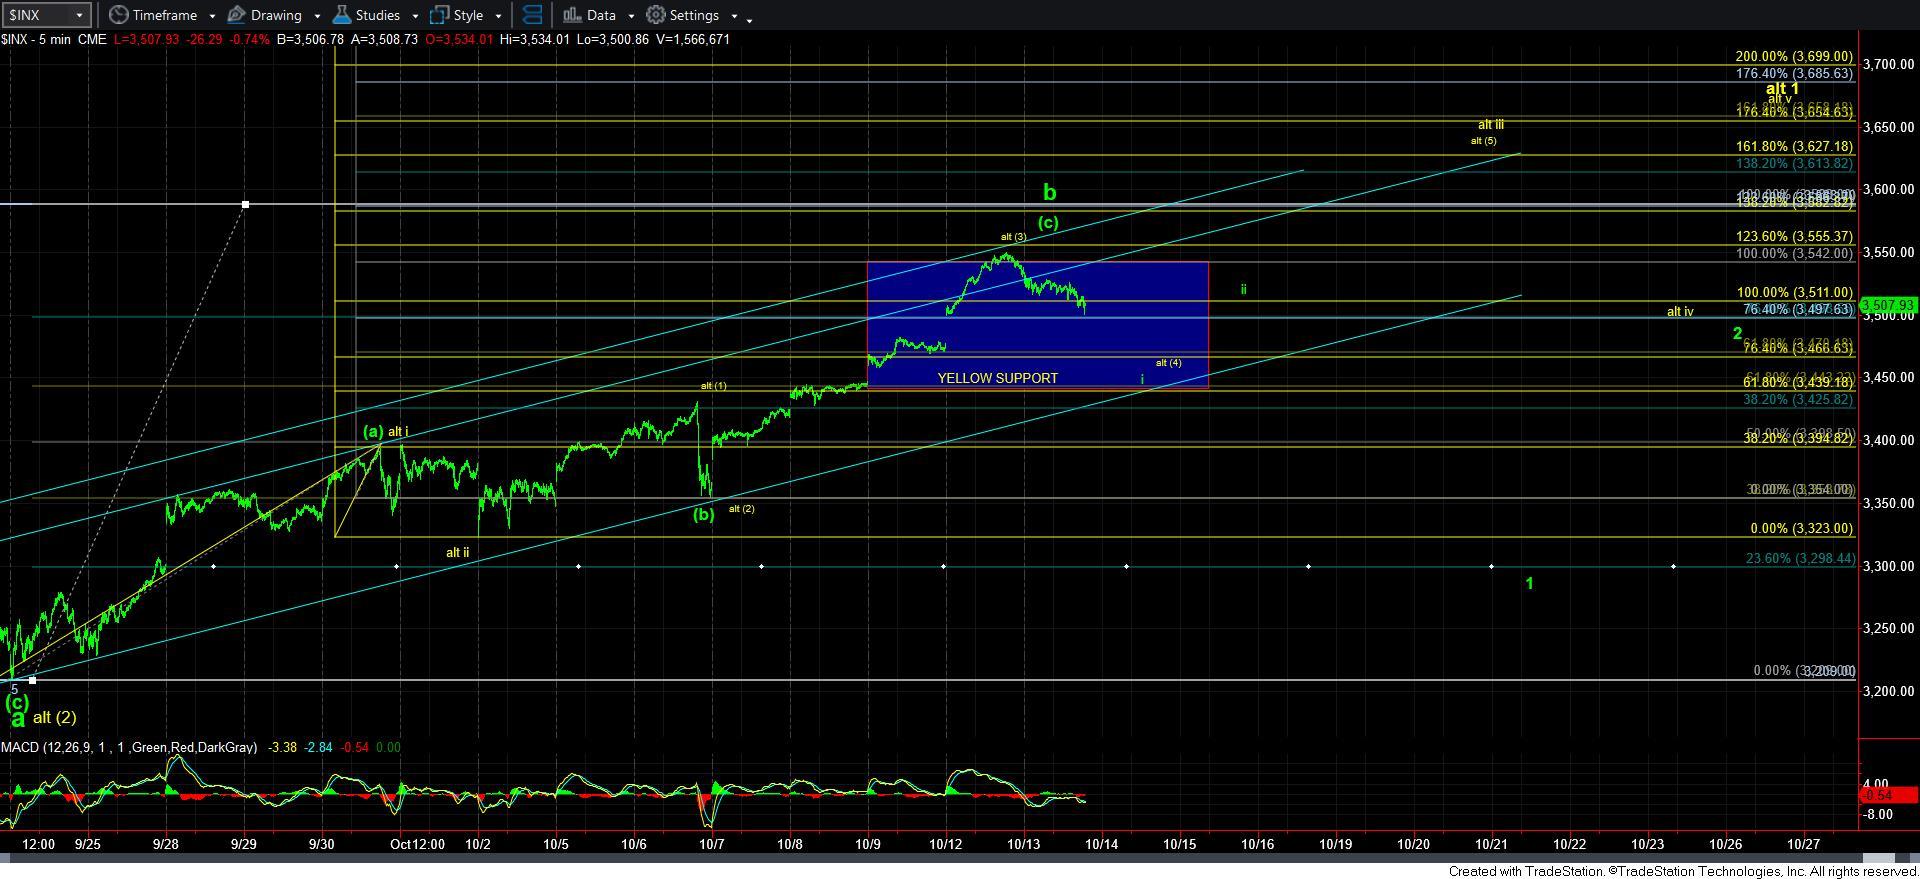
If you have been following the progression of our analysis over the last week, then you would recognize that this pullback is either wave [4] in yellow, or it is starting the c-wave down in green.
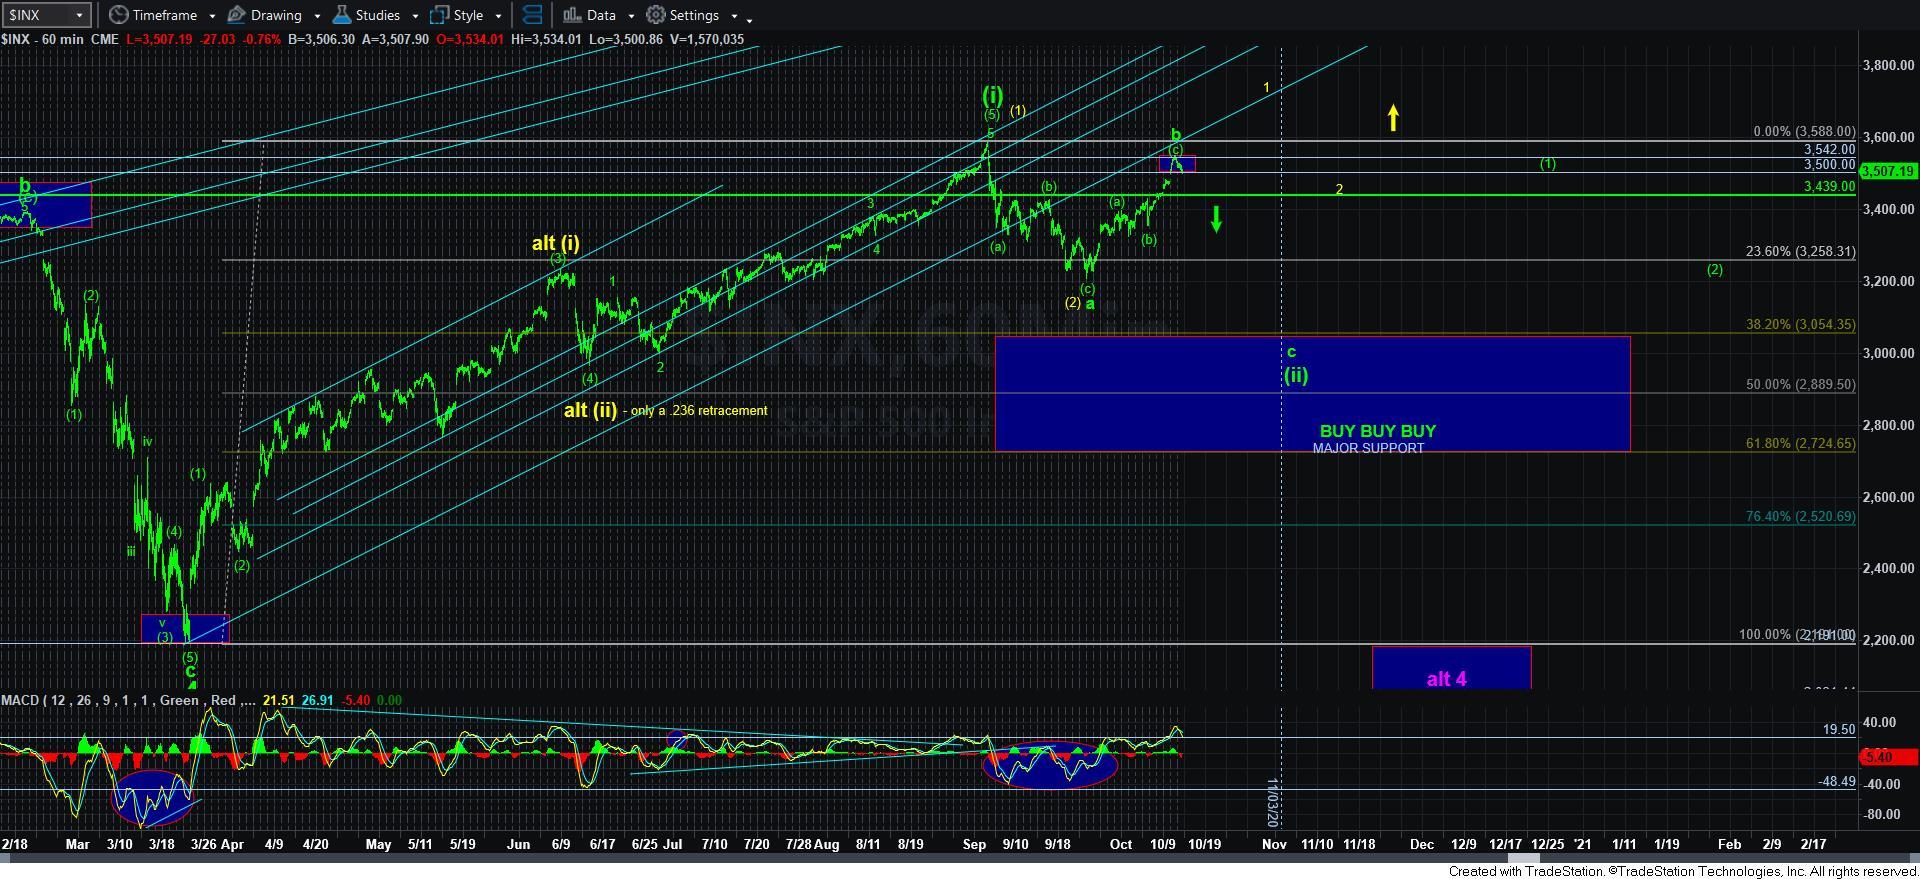
In order for this to be the c-wave down in green, we need to see a more impulsive pattern develop off the high, and I cannot say that I am quite there yet. Moreover, I am not seeing any projections that would suggest we will see an immediate break down below the important 3439-66SPX support region, unless, of course, we see massive outsized downside extensions. But barring some unusually large extensions, I think will have to see how the market moves down to our support below in order to glean more information as to whether the market has indeed topped in the b-wave or not.
At this point in time, I want to add another layer to this discussion. In the event that the market pulls back correctively towards support below, and then sets up to rally to the next higher target in the 3582SPX region, I would have to note that the yellow count would begin to gain in probabilities. But, I want to be clear that this would NOT mean that the green count would be invalidated. Rather, it would simply mean that it would be somewhat weakened.
Therefore, technically, even if we do see the [4][5] in yellow take us up as high as the 3582SPX region in the coming week or so, it can still be a bigger [c] wave in the b-wave. And, how the market drops from that high will either break support thereafter, or it will maintain support for wave iv in yellow and provide us with a 5th wave higher high to complete wave 1 of [3] of [iii] in the more aggressive and immediate bullish count presented in yellow.
Ultimately, it means we have to take this one step at a time. For now, we will have to carefully watch how this pullback handles the initial 3439-66SPX support and the structure with which we drop off yesterday’s high. If we have indeed topped in the b-wave, then we will continue lower in impulsive fashion, and ultimately break below that support in the coming days. If not, then we will set up to rally to the 3582SPX region next, and will go through this exercise one more time for a final determination between the yellow and green count.
And, to remind you again, my expectation remains that our next larger degree target is in the 4000-4250SPX region. The difference between the yellow and green counts simply tell us whether we have begun that rally at this point in time, or if we have one more bigger bout of weakness back down to the 2900-3050SPX region before we begin that next rally phase. And, I think the 3439/66SPX support region is a major signal point within that determination.