Projections Mean A Lot
I am often asked how we are able to identify the turning points we find in the market. And, my answer to that is that we are always looking for multiple points of confluence, as well as where the market is projecting within the smaller degree moves. At the end of the day, everything should line up for a higher probability wave structure.
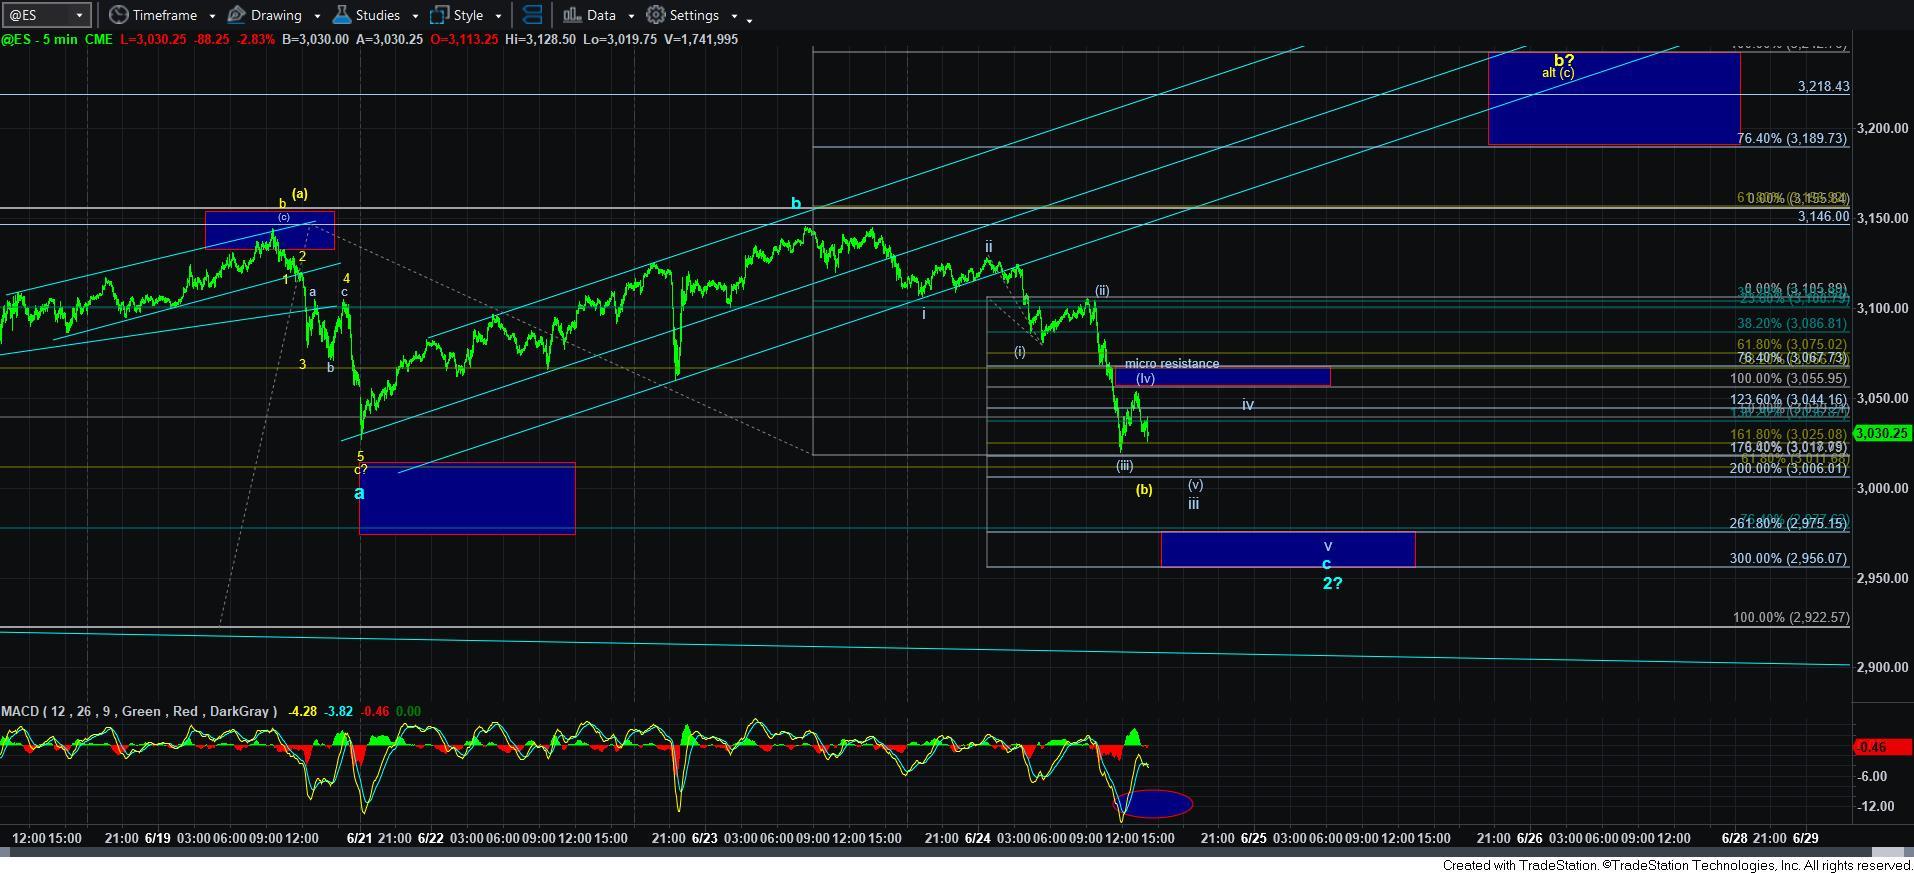
So, when the market broke support and gapped down this morning, I gave it us an opportunity to set up a downside structure pointing to the 2900SPX region. However, when it decided to drop in a more direct fashion with a i-ii, [i][ii] structure off the high (shown on the 5-minute ES chart), it made it much less likely that the break down was pointing us to the 2900SPX region directly . . . well . . . at least from a higher probability perspective. Of course, the market can provide us with a very unorthodox and lesser likely path down to that region. But, I have to go with what I see as the higher probability structures.
Now, before we began this whipsaw action we have been experiencing of late, I started posting the “whipsaw” logo in the trading room, and warned you that we have likely entered a whipsaw environment. This is what I mean when I often tell you that understanding the market context is quite important. This is what prepared us for the whipsaw environment, and should have caused you to adjust your trading strategy and use more caution.
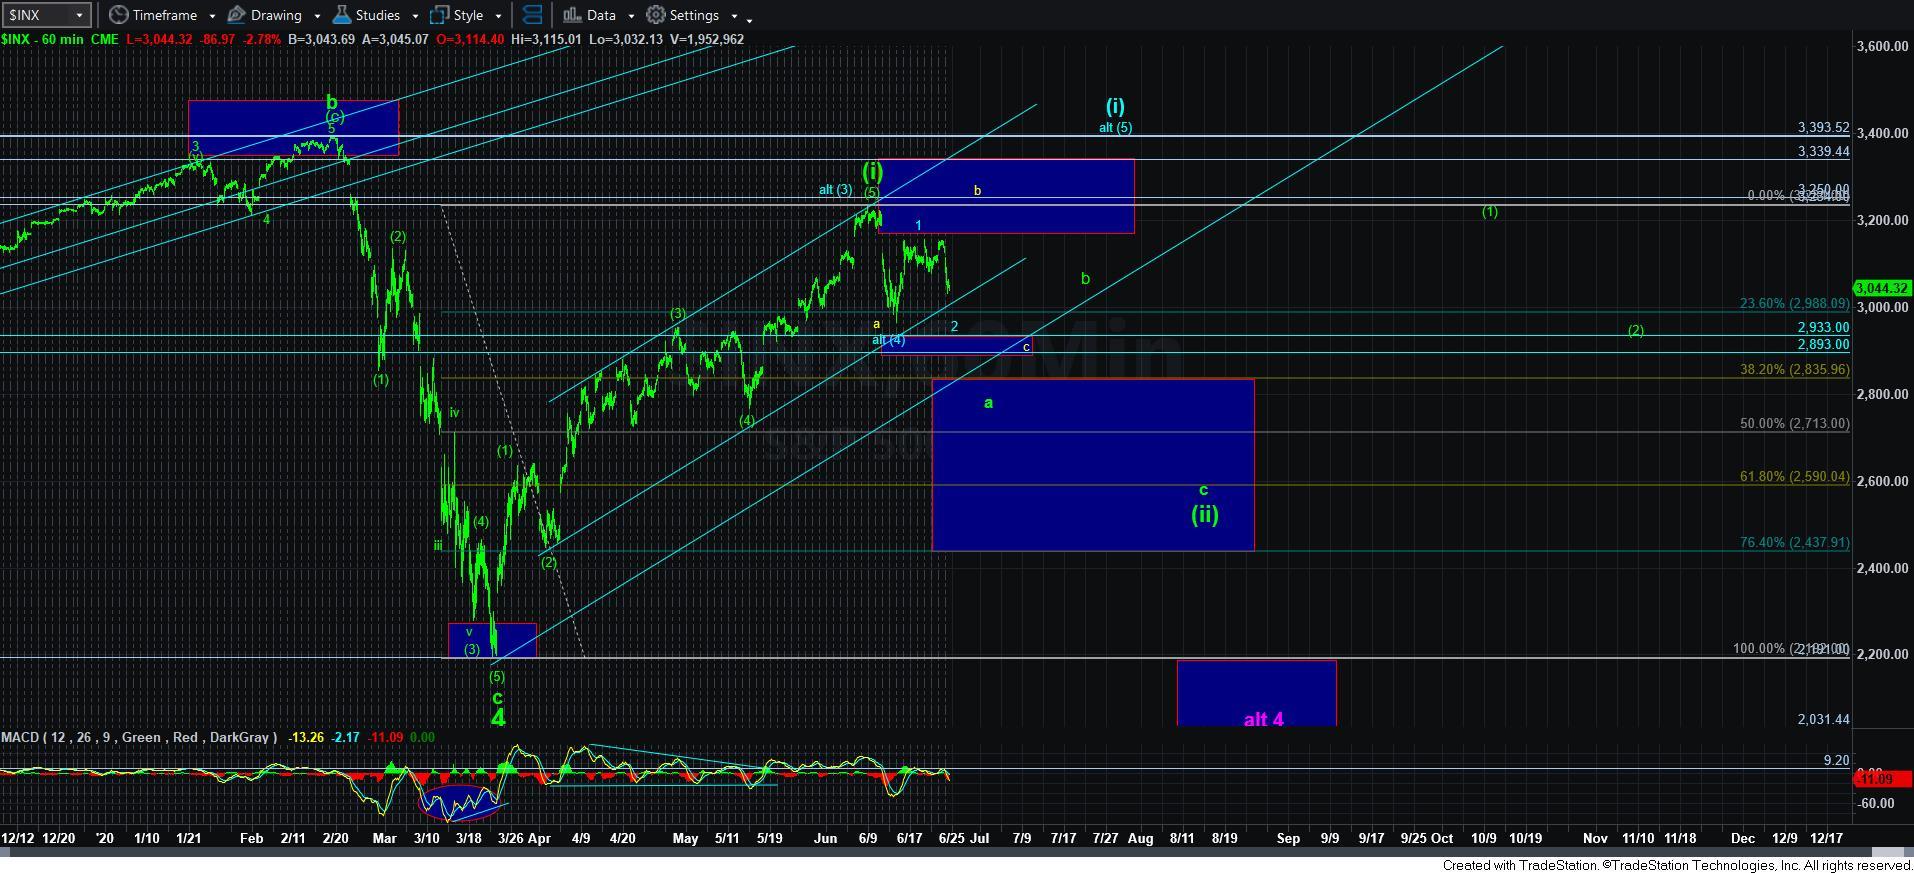
When you review the current charts, the bigger potential patterns discussed over the weekend still are being tracked, as I still cannot discount any of the three just yet. But, I think the next day or two will provide us more clarity as to whether we have begun wave [5] higher in blue just yet. As I noted over the weekend, I really need to drop down to at least the 2980ES region to make that a higher probability. And, I explained my reasoning the weekend update.
So, currently, if the market remains below the 3055ES level, we have an immediate pattern pointing us into the 2956-2975ES region, which is an ideal target for wave 2 in blue. But, it means we still have to complete waves [v] of iii, iv and v of this c-wave of wave 2 before breaking back out over 3055ES region.
However, if we do not drop that low, and begin a rally through the micro resistance sooner, it brings back our yellow [a][b][c] structure of a larger b-wave, which would be targeting the 3200-3250SPX region before we turn back down again in the c-wave.
In conclusion, I know this sounds complex, especially to those of you who are new to Elliott Wave analysis. This is what happens during corrective structures. But, all of this analysis comes down to a very simple proposition: as long as the market remains over 2956ES, then we have a path to take us back to the 3200SPX region, and potentially even higher (in the wave [5] in blue). However, should we break down below 2956ES, then we will test the 2885/2890SPX support.