Probabilities For Higher Highs Have Increased
 By
Avi Gilburt
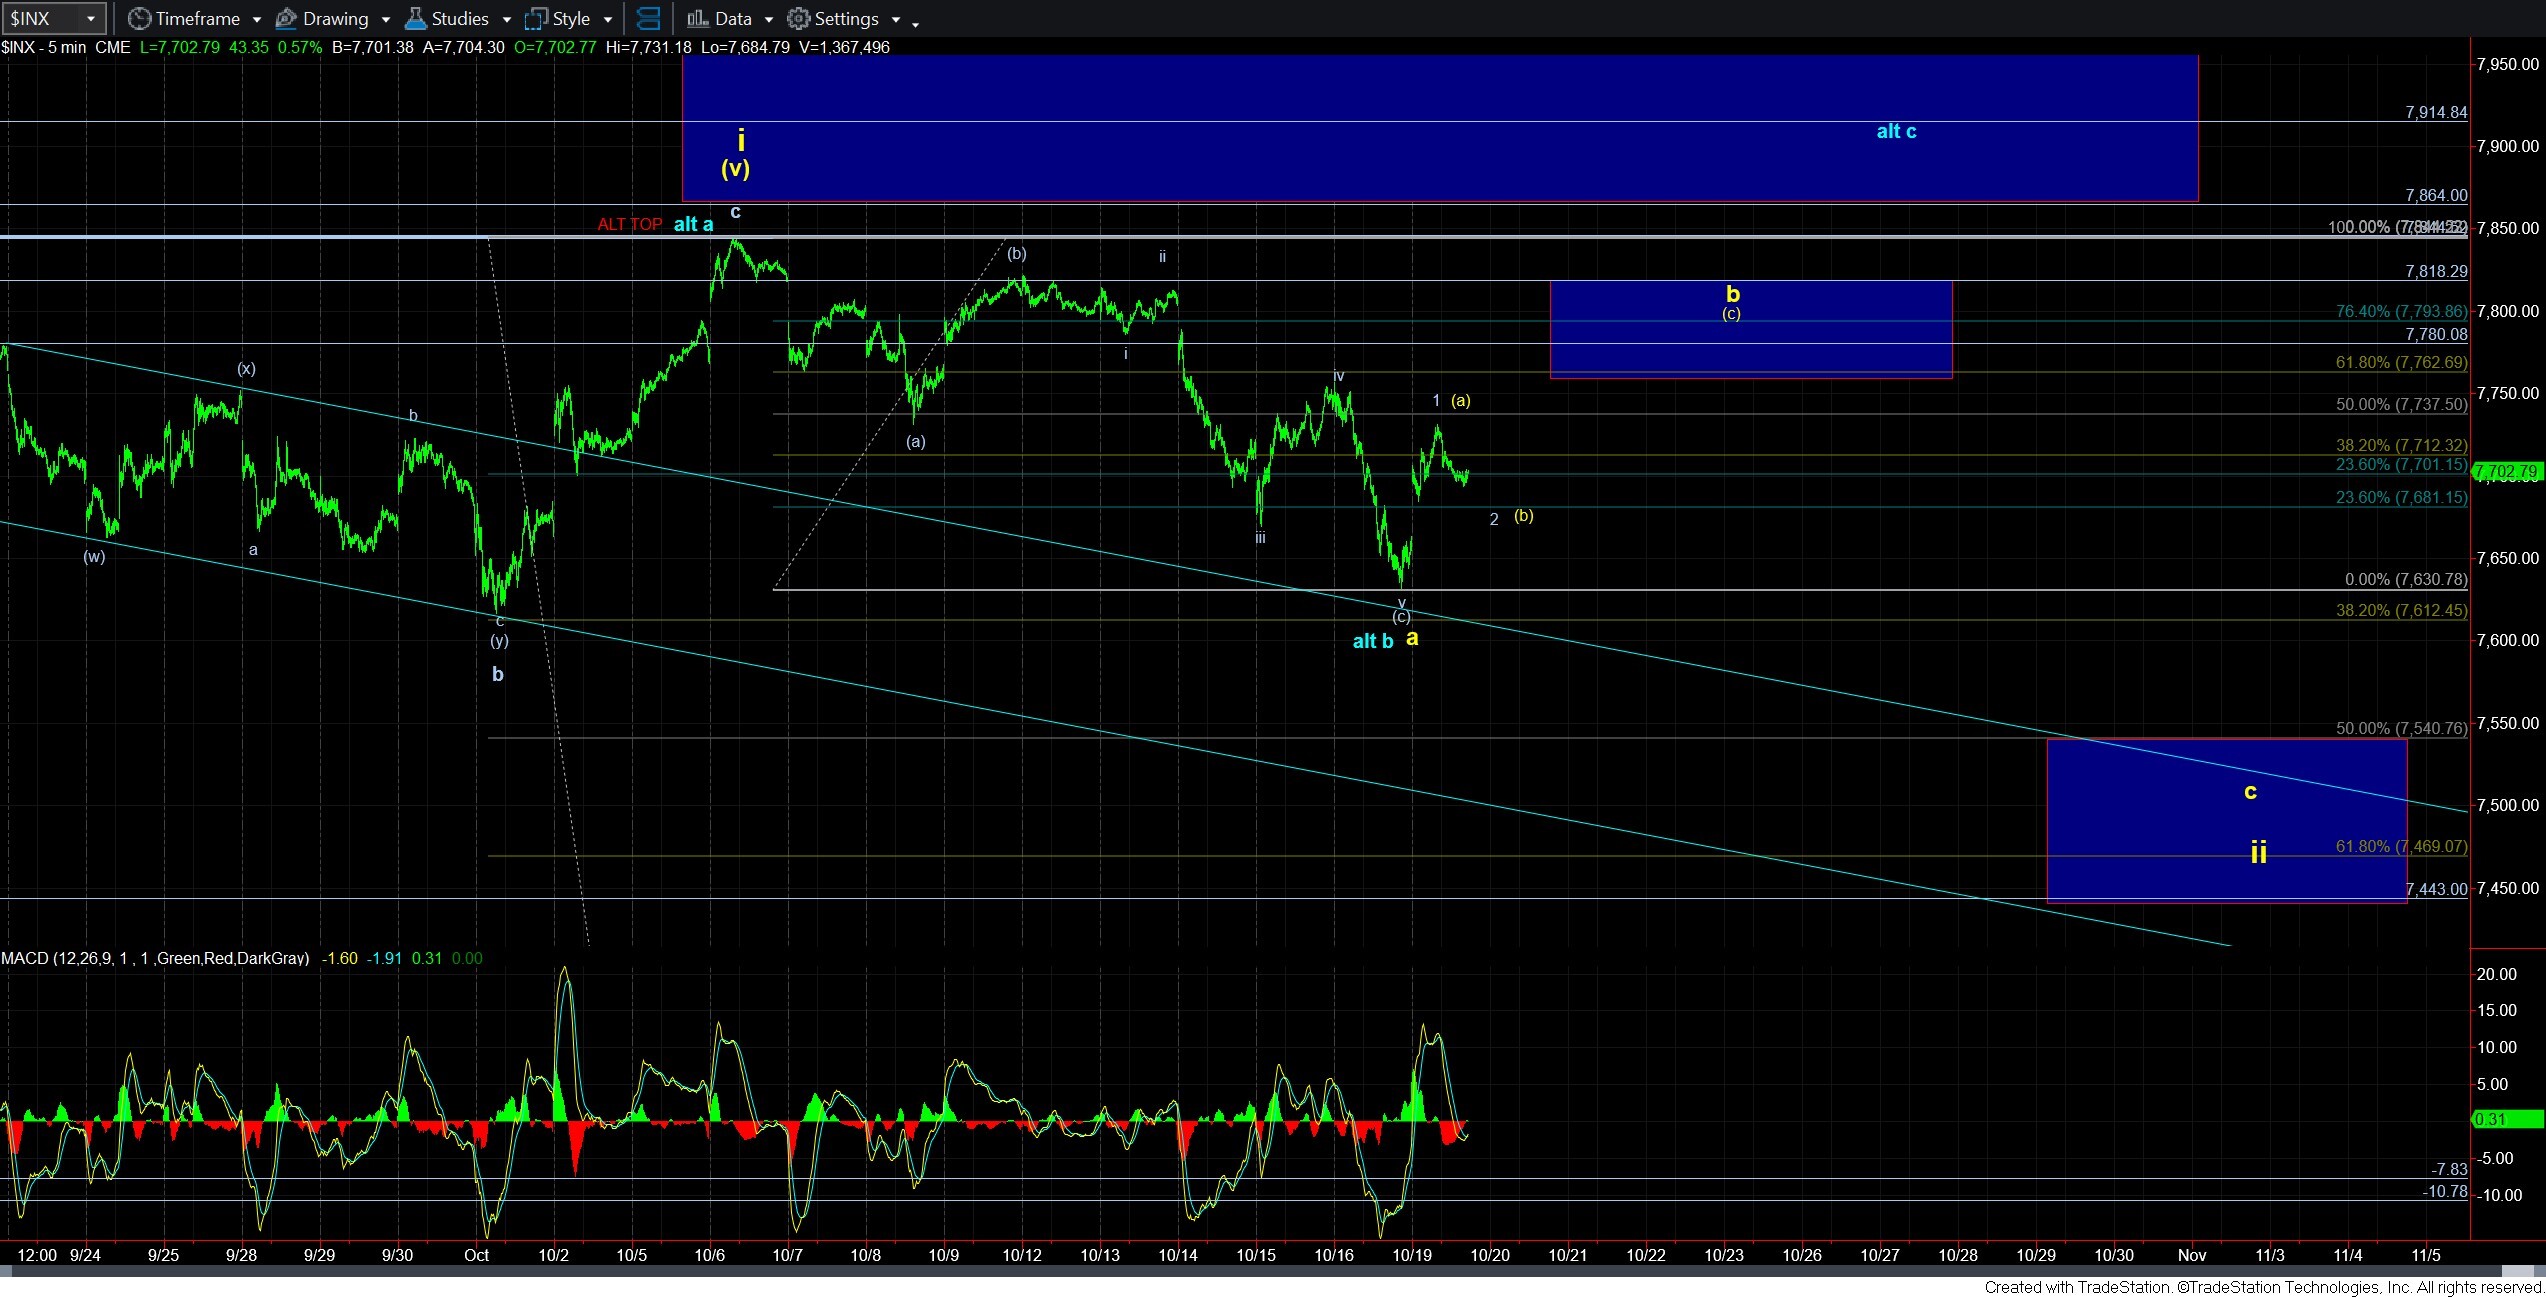
If you read my analysis over the weekend, you would know that I was watching the rally off Friday’s low very carefully to see if we get any clues that the market may still try to reach higher highs, as per the blue alternative count.
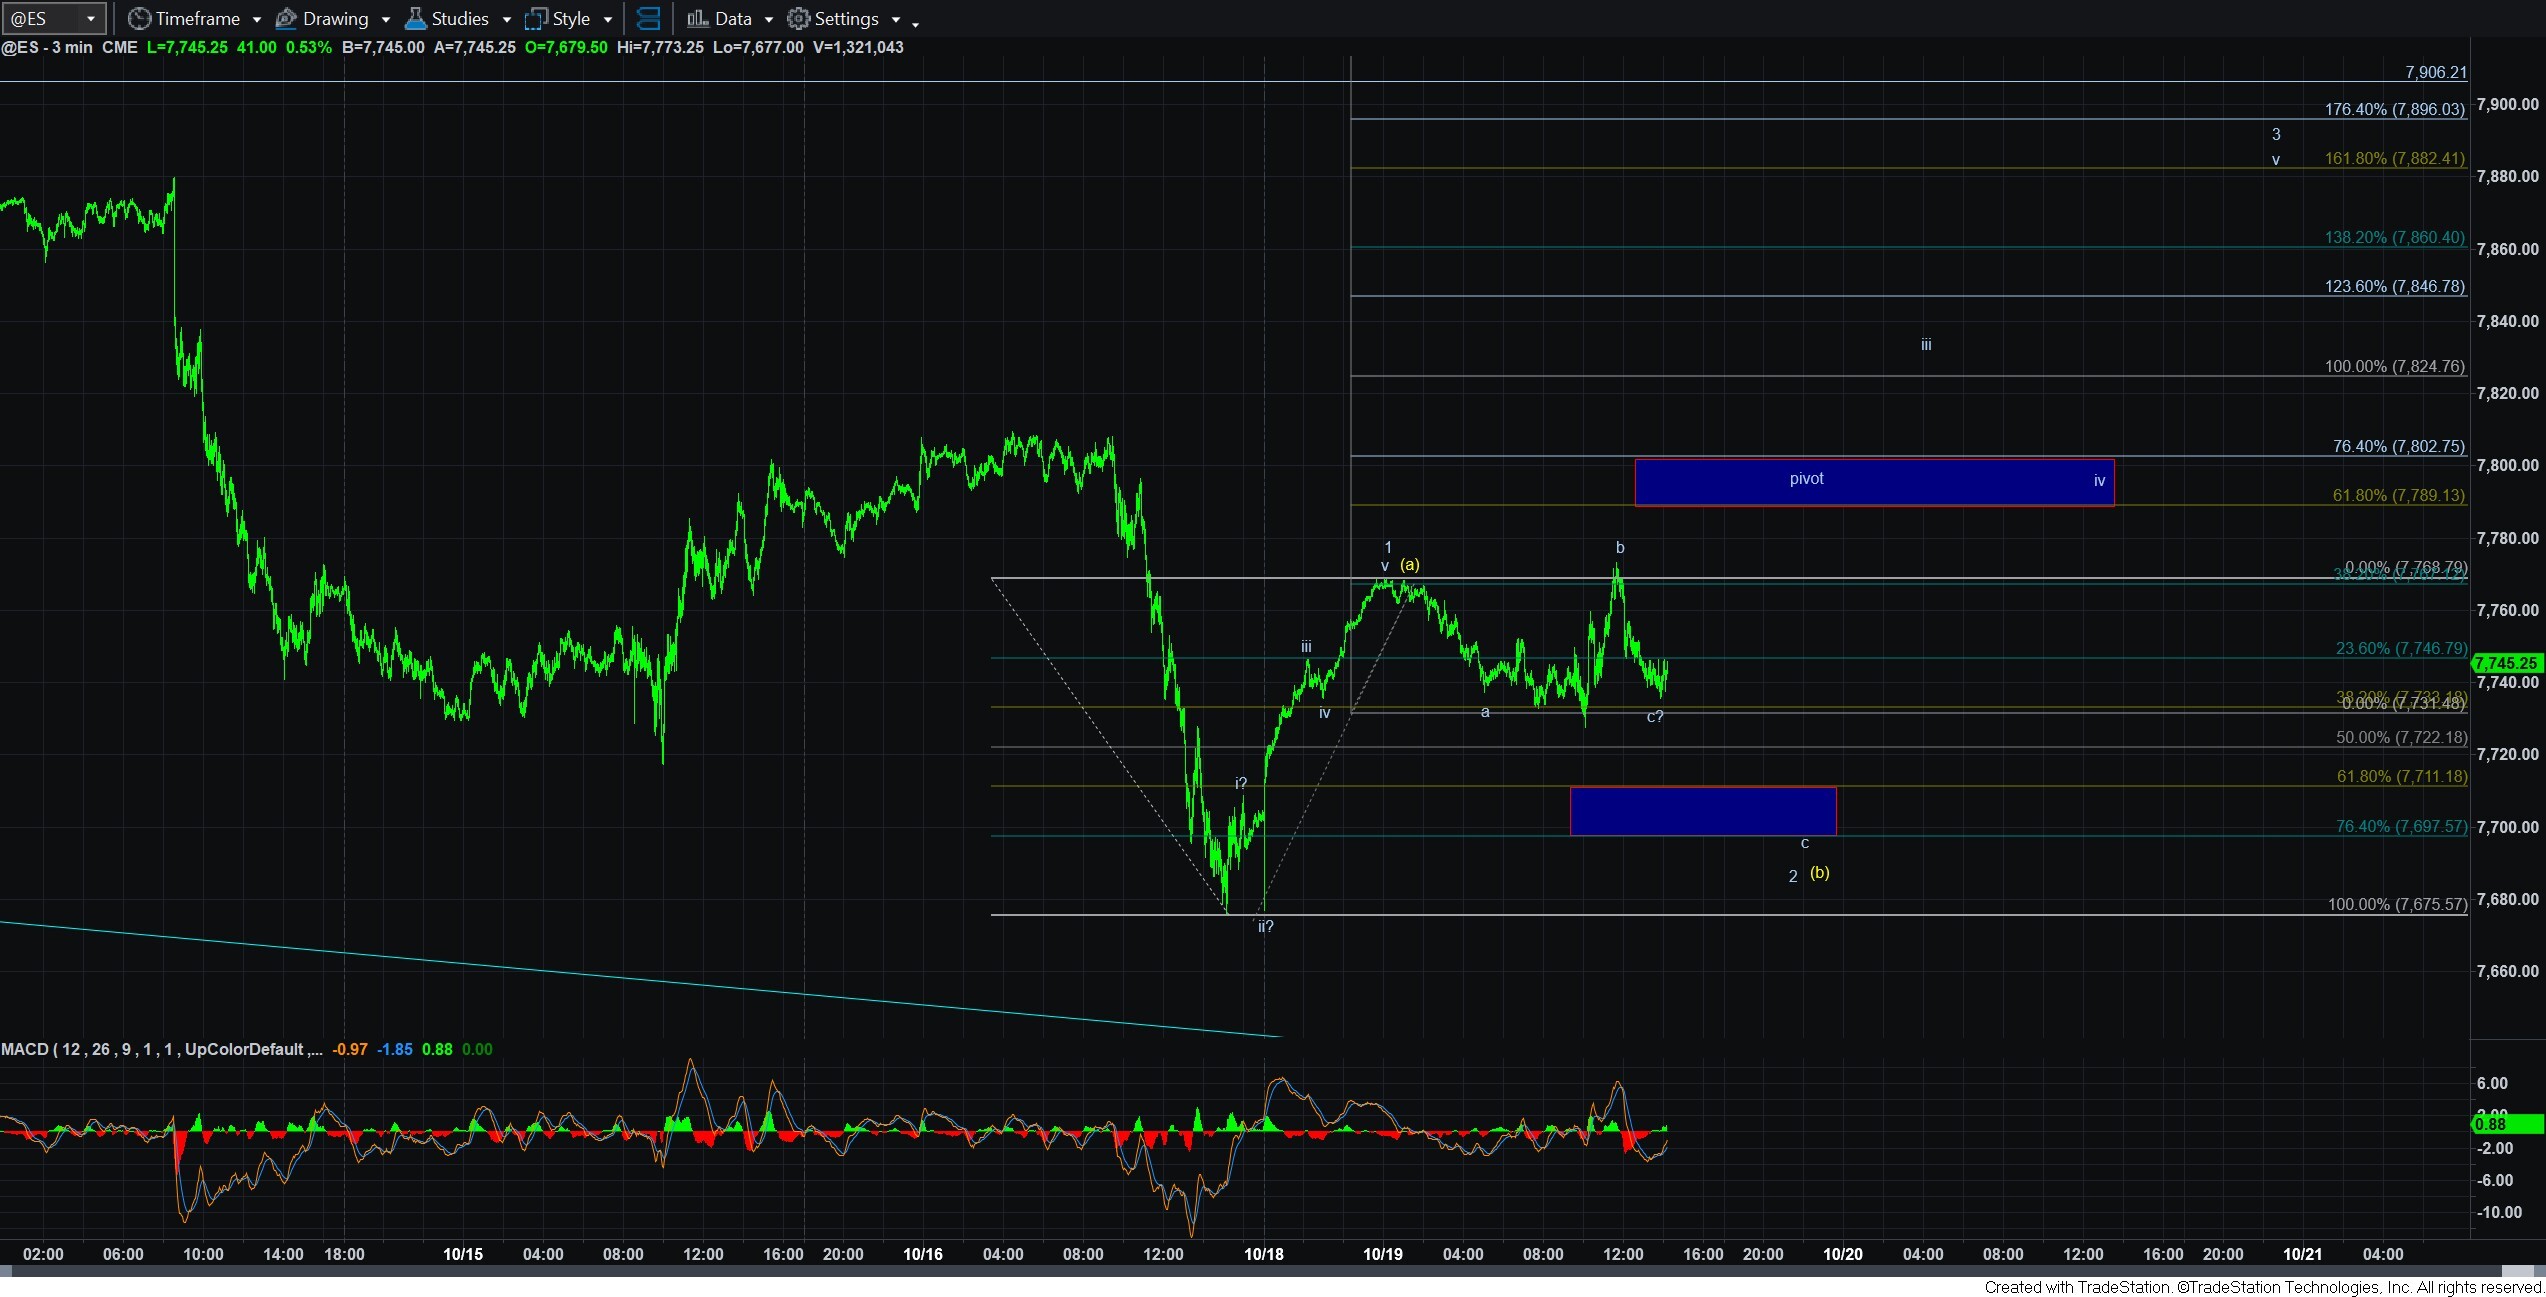
Most specifically, we were seeking a reasonable 5-wave structure off the low. And, the futures seem to have provided us with that structure in the after hours market into the overnight session on Sunday night. I have included that wave count on the 3-minute ES chart attached. Thereafter, we seem to be tracing out a corrective wave 2, which you can also see on the 3-minute ES chart.
As I write this, we have the minimum number of waves to complete an a-b-c corrective wave 2 structure. But, until we actually break back out over the high struck today in the futures, there still exists some potential for a deeper c-wave decline to the support box noted on the 3-minute ES chart.
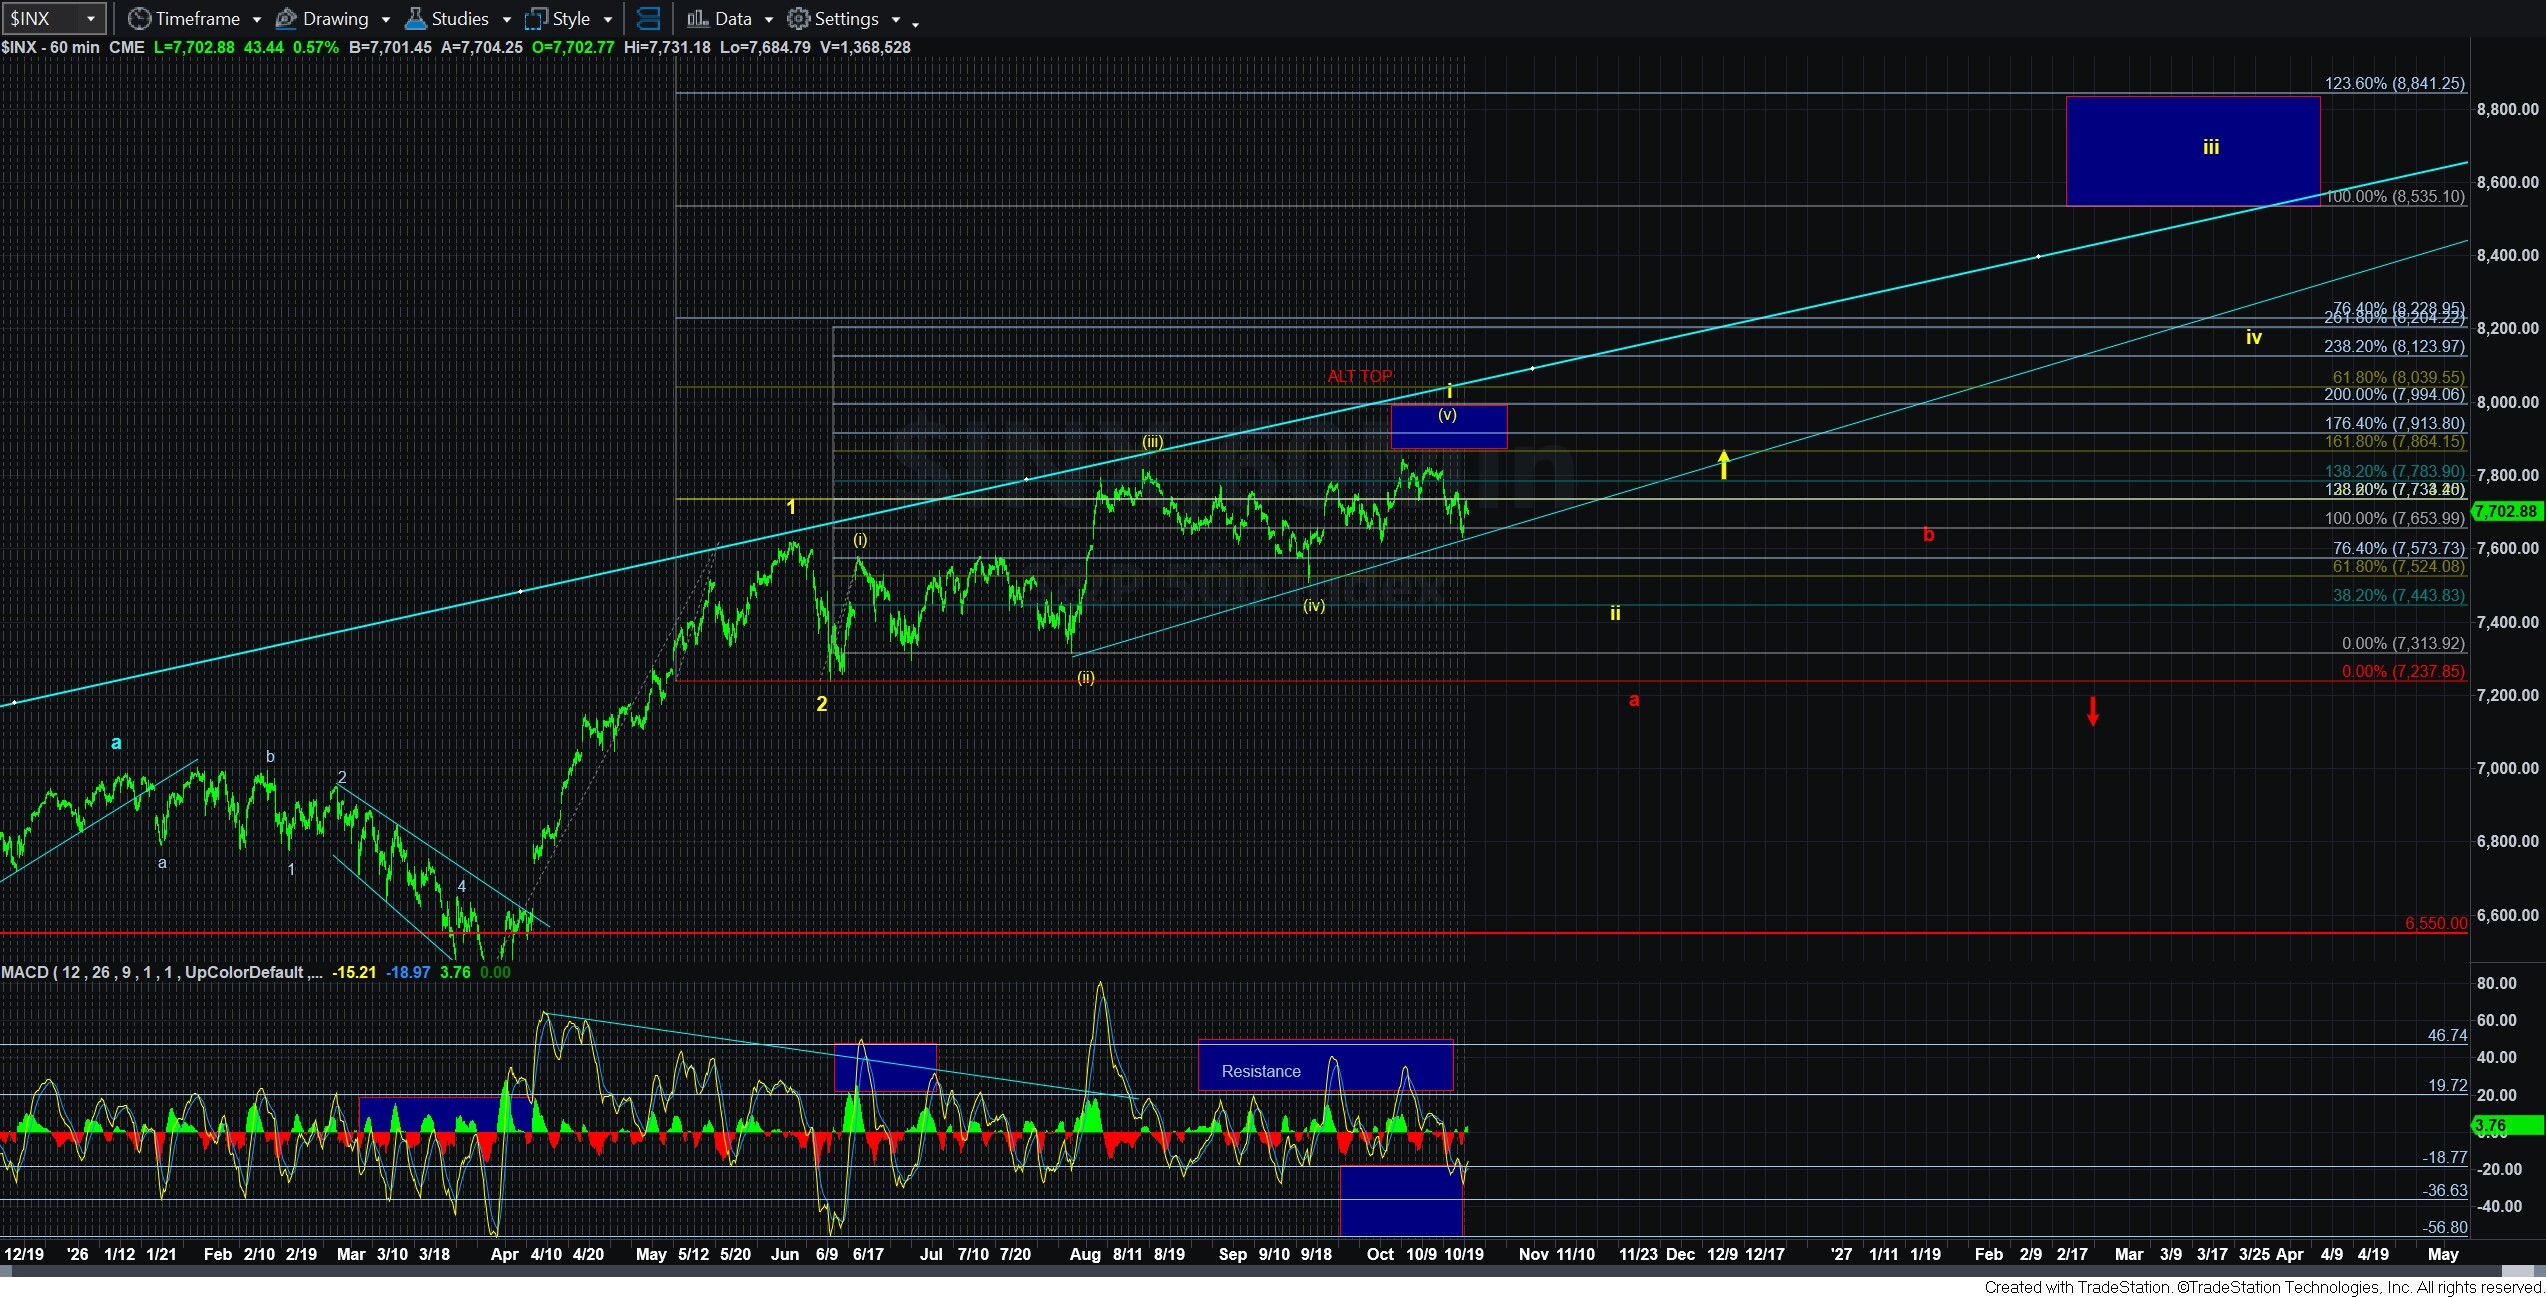
Now, before you think that I have adopted the blue count as my primary, I want to note that I would now view it as 50/50 between the yellow and blue count. Therefore, since there is a reasonable probability that we can still see higher highs, anyone that would like to trade this structure may choose to do so with certain risk parameters, as most paths still point higher in the coming days for at least a (c) wave in yellow. Whether that next rally will ultimately lead to new all-time highs will all depend on whether we will be able to maintain over support (which will be continually adjusted higher) should the market continue higher in the coming days.
As of my writing this update, we are holding the .382 retracement of wave 1 or the yellow (a) wave. Should this hold and we then break out through the pivot, that pivot will be the main point of reference for risk management. My expectation would be for the market to rally to at least the 1.00 extension for either the (c) wave in yellow or wave iii of 3 in blue, which then makes the pivot our main support. As long as that support is held during wave iv of 3 in a corrective pullback, then it increases the probability that the market is going to attempt higher highs in the blue count. However, should we see an impulsive decline back down through the pivot, that strongly indicates that the yellow count is very much in control, and that the yellow b-wave has potentially topped, and we have likely begun the c-wave decline in yellow.
So, for now, the probability for higher highs has certainly risen. And, once we break out through the pivot (whether from the .382 retracement or the deeper retracement region in the support box below), we will then have strong parameters to gauge whether the market can attain further all-time highs pursuant to the blue wave count or not. But, we still likely go higher before that decision is made.