Probabilities Are Shifting - Market Analysis for Apr 22nd, 2026
I am putting this report out a bit earlier than normal as things have begun to swing a bit more towards the blue count.
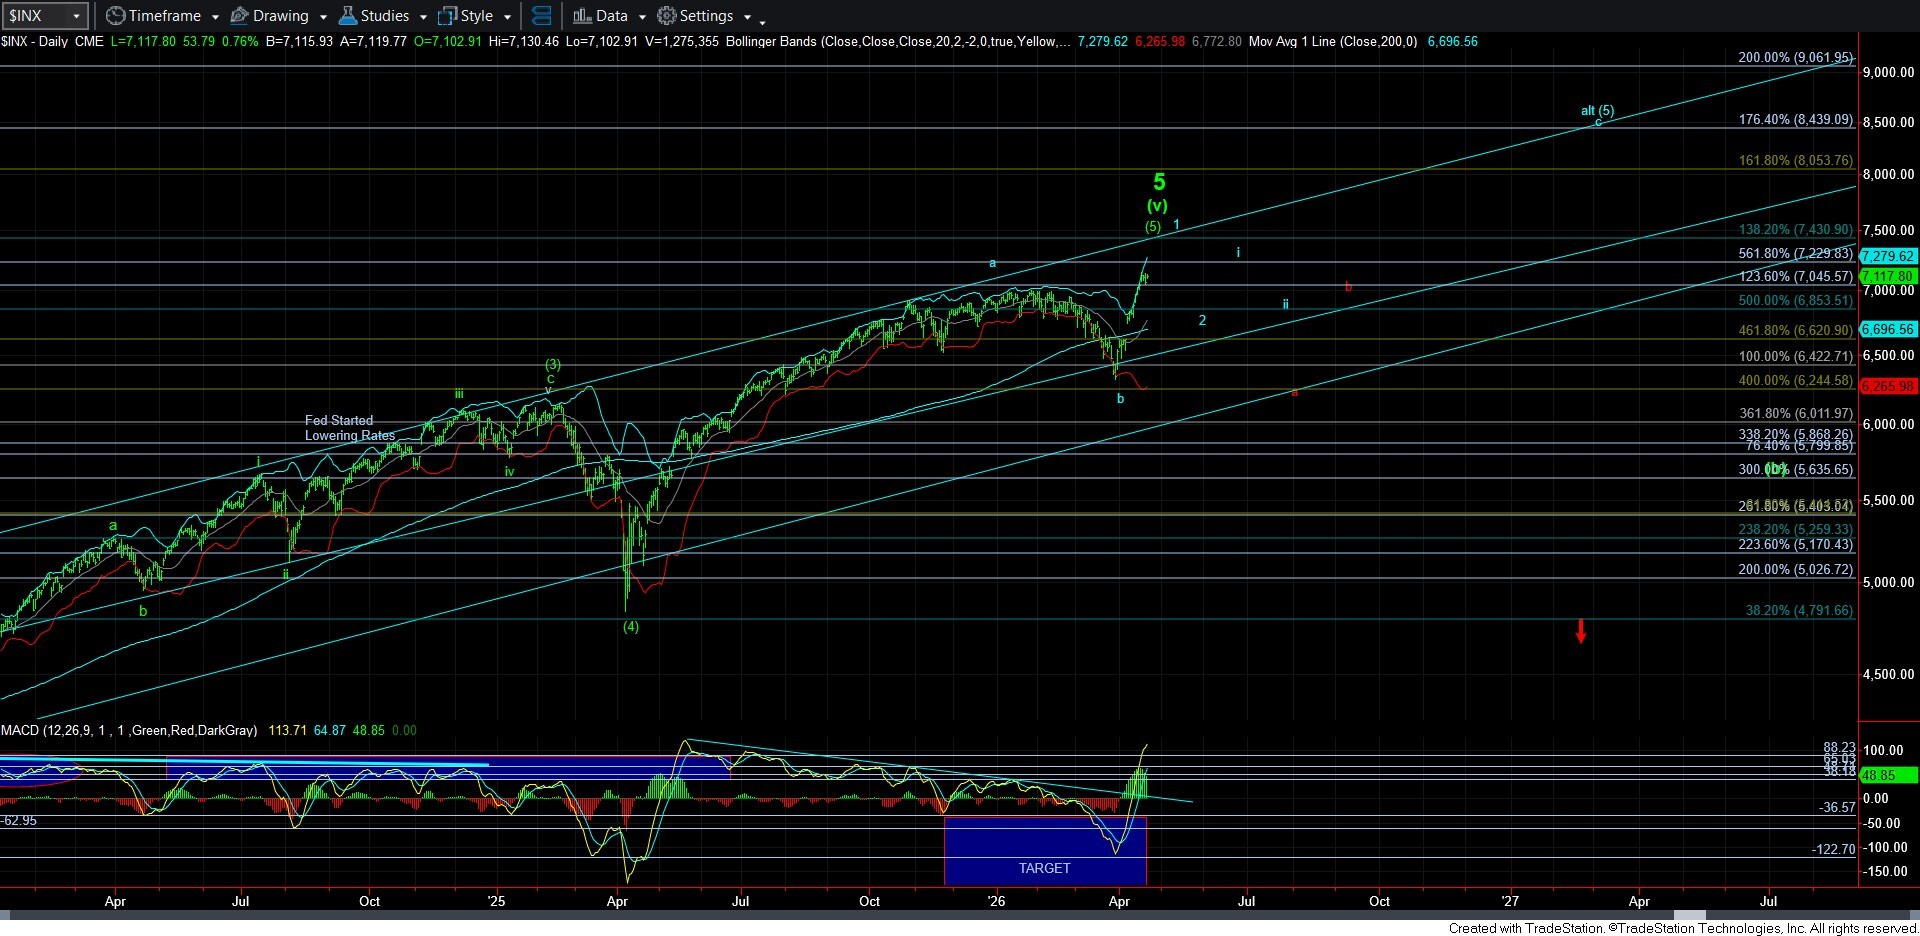
If I may remind you, that would mean that if we are to see a 5th wave rally in the coming days, then it would provide a 5-wave structure off the recent lows, which then opens the door to the blue c-wave rally seen on the daily chart pointing us to 8000 and potentially a bit higher.
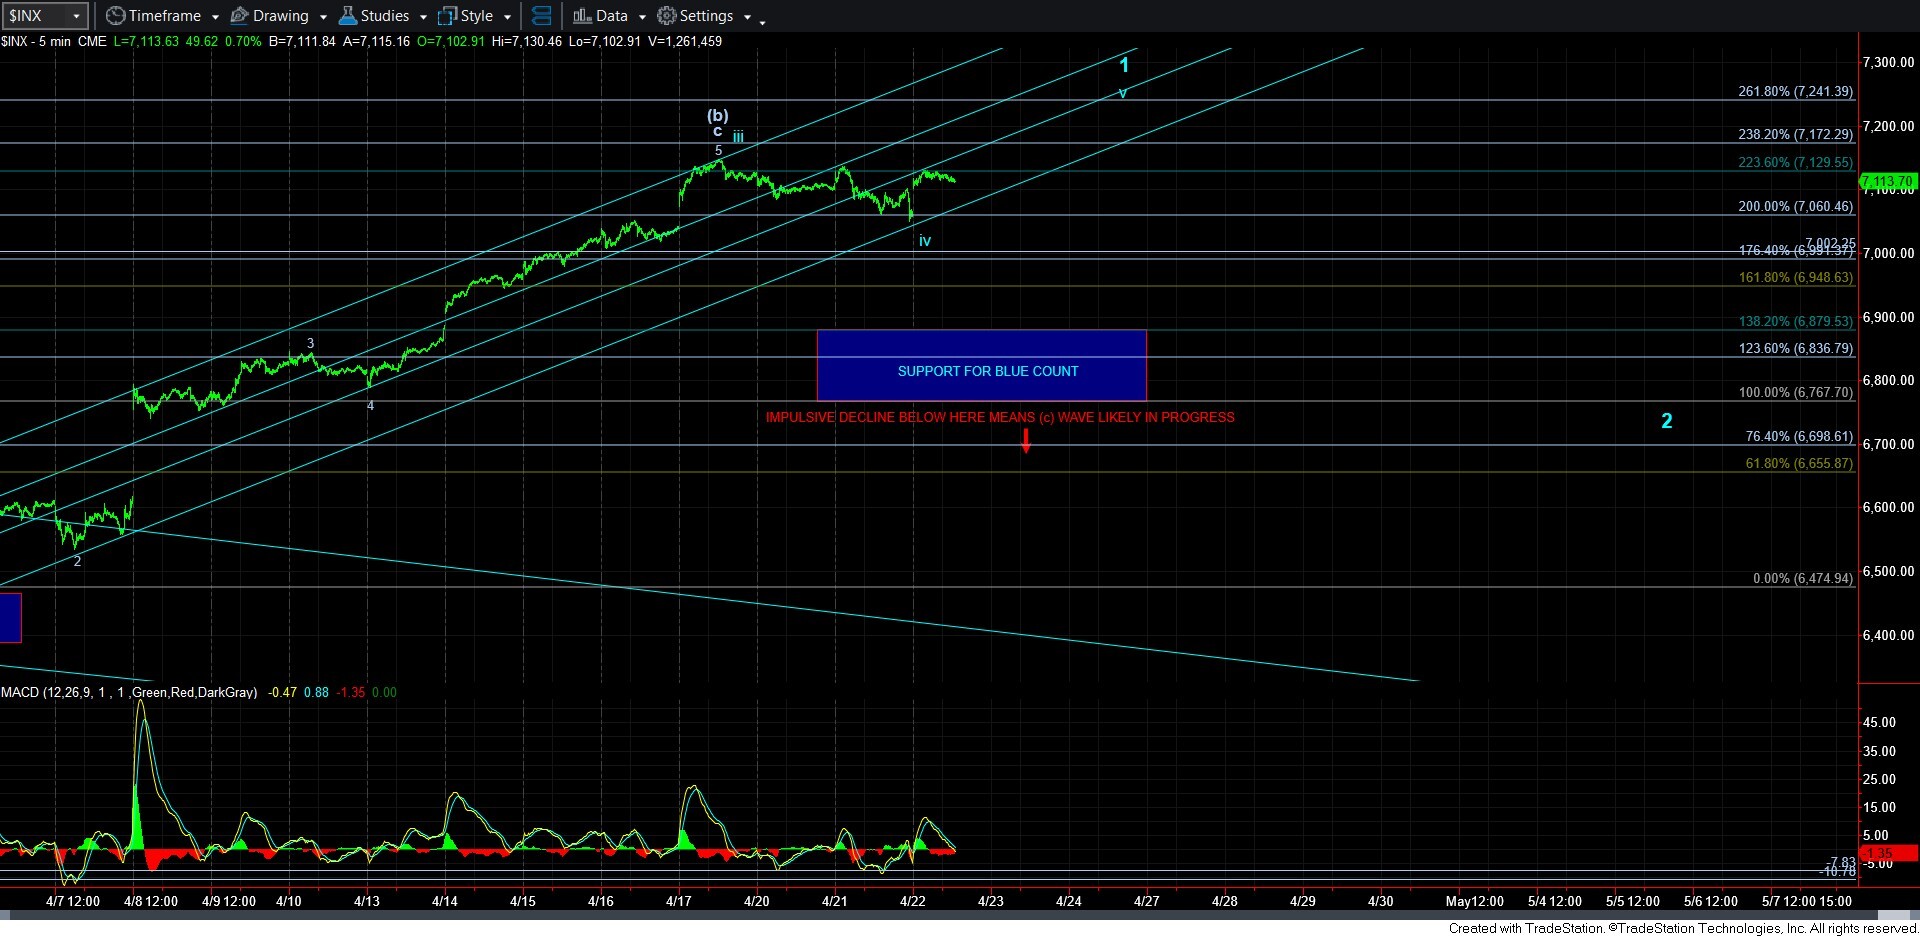
But, before I go into the bigger picture, I want to follow up on the analysis from yesterday. As I warned, if the market was unable to break down below the a=c projection for support (which it held to the penny in the futures), it opened the door for us to be seeing a very shallow wave iv in the blue count, which could lead to a rally for a 5th wave.
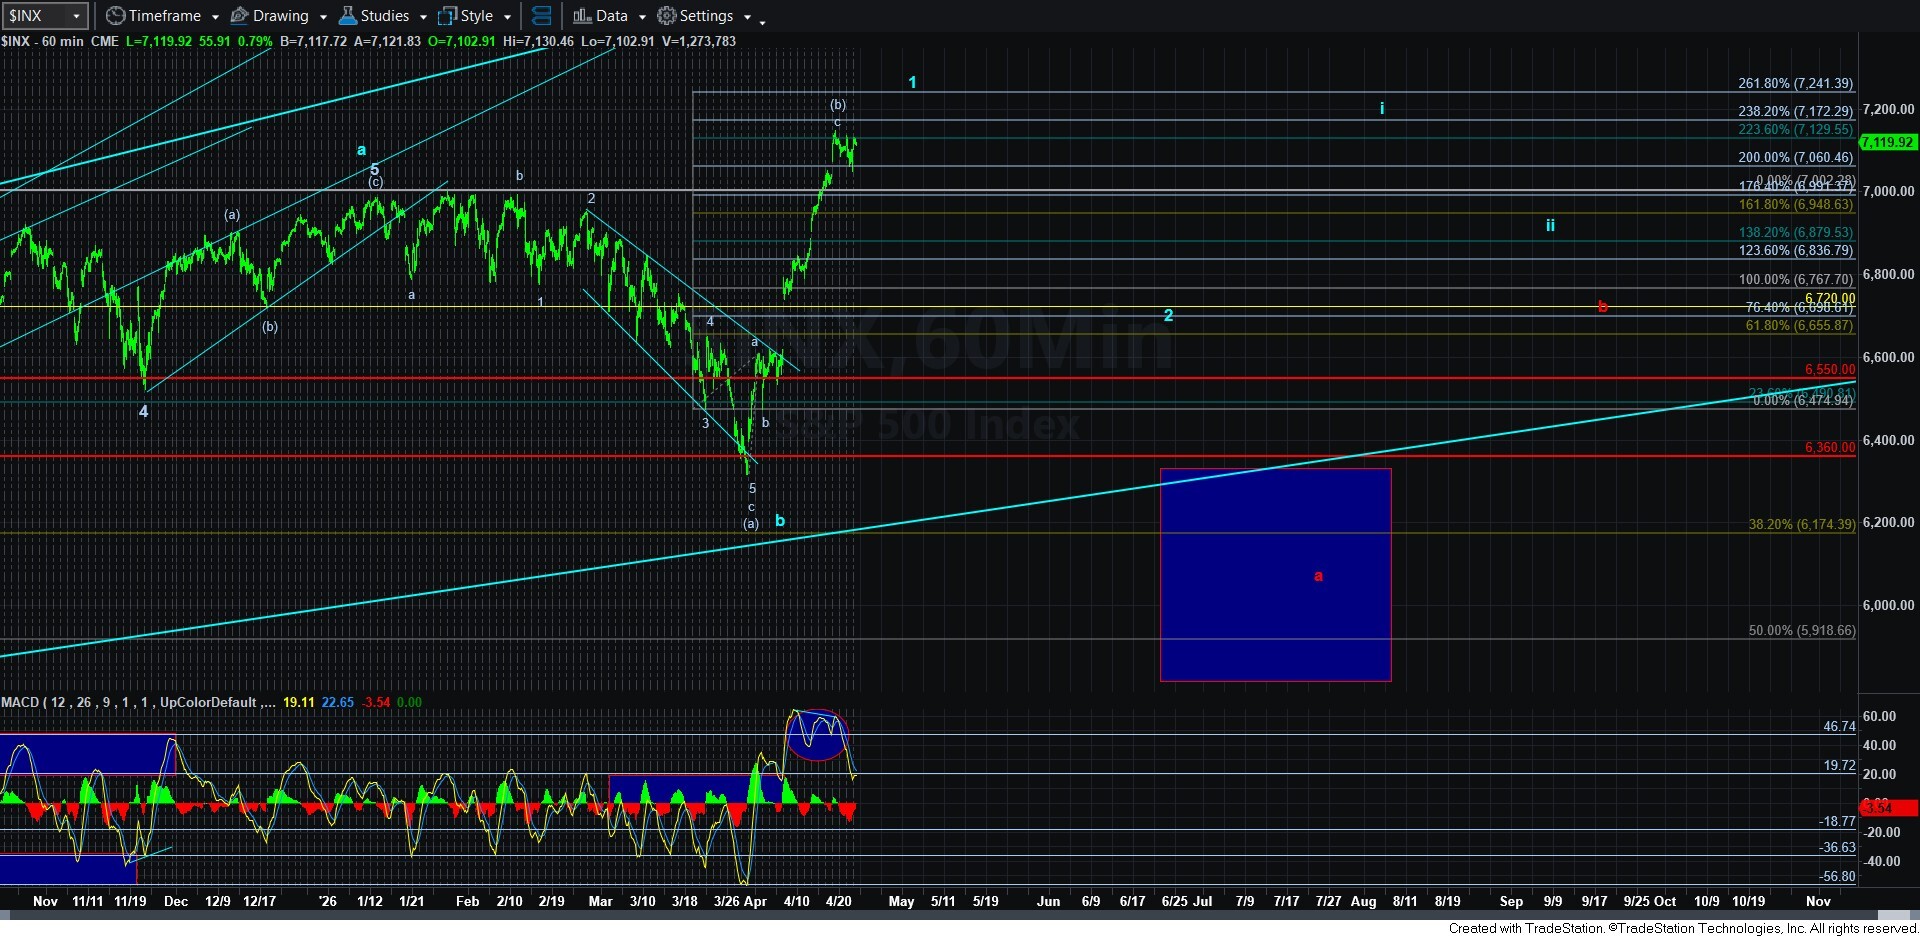
In the event we see that rally, followed by a clearly corrective pullback, then I would have to view the potential for the blue count as seriously increasing in probability. What would then solidify this potential for me would be another smaller degree 5-wave rally, which would then set up a potential 1-2, i-ii, now outlined on the daily chart, and this would make the blue count a much higher probability and a very strong primary wave count. In fact, I would probably be deploying the cash I raised in the event we see such a set up in the coming weeks.
So, while you are looking at the daily chart, I want you to notice that I have modified the labeling to assume that we are going to see that higher high in the coming days. Again, the adjustment is based upon an assumption we do see that higher high. If we break down below yesterday’s low before that 5th wave rally is seen, then all bets are off, for now.
Again, if we do see this higher high in a 5th wave, it can still then represent the completion of a long-term topping pattern, for which there is a lot of evidence of its potential in many other charts. Moreover, if we do strike a long-term top with a higher rally, the decline therefrom will likely be a 3-wave corrective structure. So, it would not look any different than the blue wave 2. That is why seeing another 5-wave rally off that potential wave 2 pullback is so important to the bullish thesis, as that would make the count suggesting the long-term top being in place much less likely and point us strongly to the blue count.
So, while probabilities may be shifting – especially if we see a 5th wave rally in the coming days – I will not personally deploy my own money into the market until we see a strong 1-2, i-ii structure develop, which would make it a high probability at that time that we are heading to 8000. Until such time, there still exists a significant amount of risk for a long-term top to be struck. Moreover, a break-down below yesterday’s low without a 5th wave rally would also increase risk to the downside in a more immediate manner. I know I am repeating myself, but I need to make this situation clear to all our members.
Therefore, while the market has been keeping us within a 3-wave convoluted structure for some time, we may be emerging from that environment if we are provided the parameters outlined above for the blue c-wave. Until such time, please continue to recognize the risks inherent in this very stretched long-term market structure.