Probabilities Are Shifting - Market Analysis for May 9th, 2019
I am putting this update out early, and will send out another one tonight if we see more action to fill in more of the smaller degree pattern. But, the larger degree structure to keep in mind is that the market is likely topping and setting up a larger decline, as we have been outlining.
As I have been saying for the last several days, the structure into the high we struck last week is not a clearly completed b-wave structure. While corrective action can certainly complete in such fashion and hide its topping structure, we normally see a completed 5-wave c-wave into a topping structure. I have no such clear structure in place into the high struck last week, which points to the potential that it MAY be one of those “incomplete” b-wave tops.
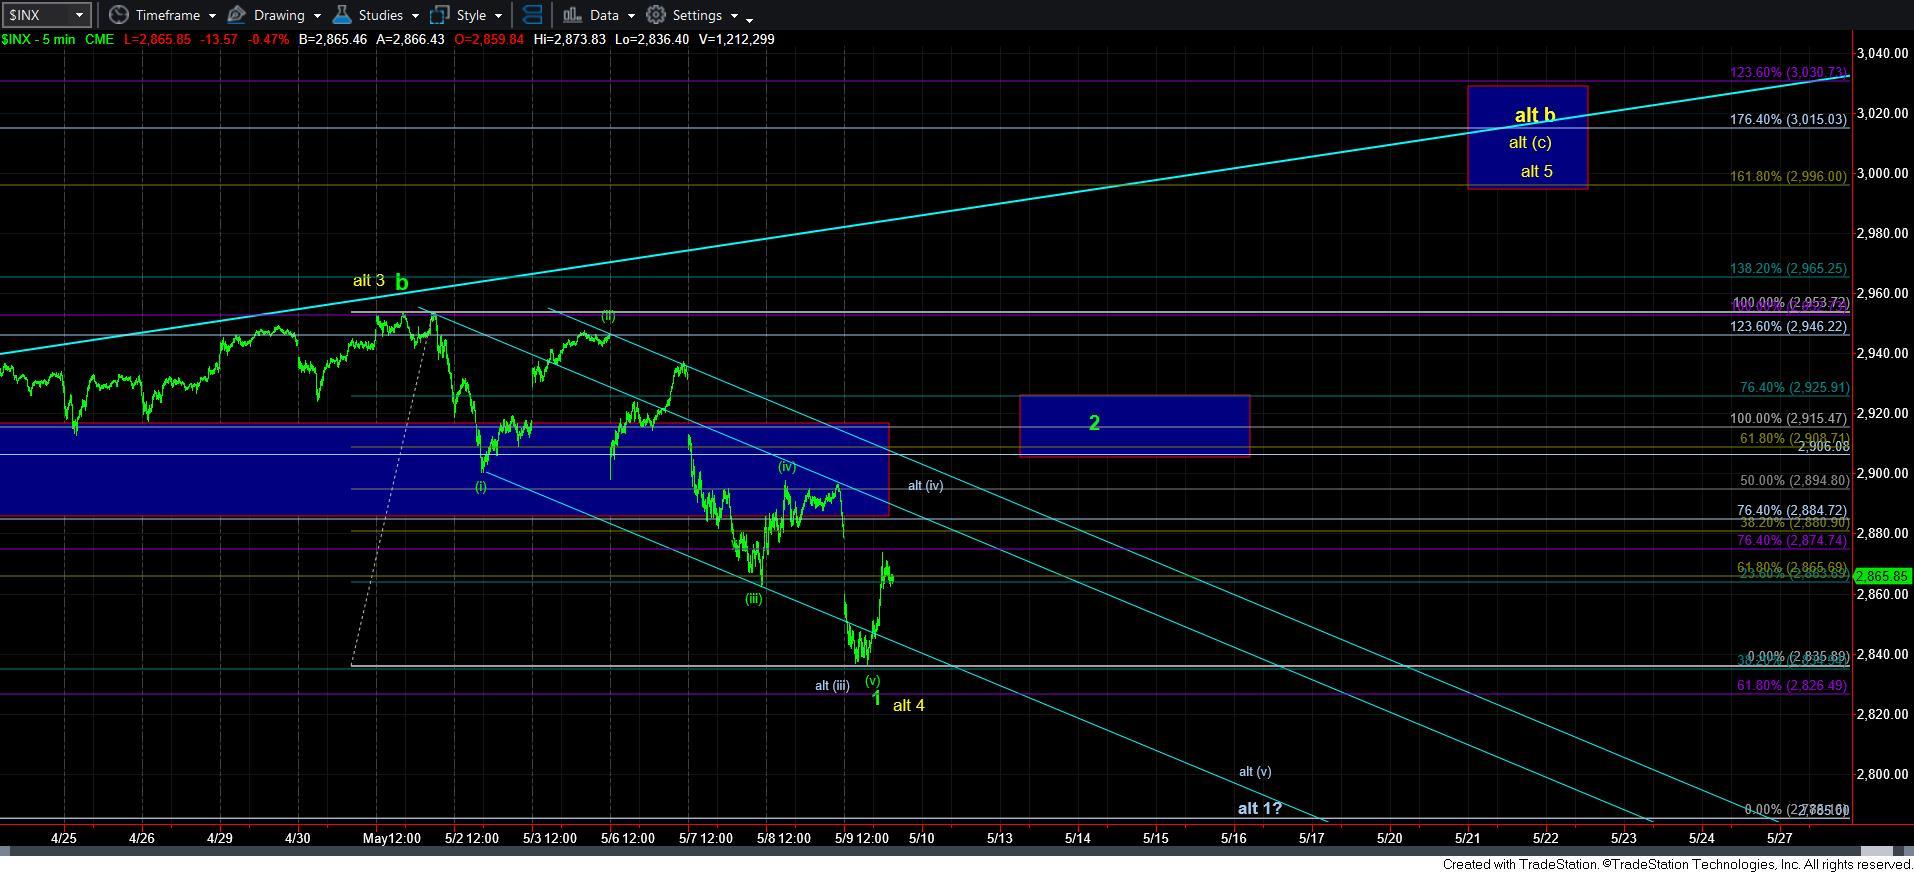
For this reason, I needed to see a minimal 5-wave structure to the downside to consider us as having topped already. While my preference for such a 5-wave structure would have been a standard impulsive decline, we did not see that either. Rather, the best way to count the downside structure off the high would be as a leading diagonal. And, as I have noted many times before, I have a hard time trusting diagonals when it comes to trading the market in an aggressive fashion.
But, with the further weakness seen today and the break down below 2850SPX, we have a minimal count to support 5-waves to the downside.
So, this leaves us with an incomplete b-wave top, followed by a potential leading diagonal to the downside. While I certainly would have preferred more clear market signals from this structure, unfortunately, I don’t have much of a choice but to accept what the market gives us. And, for this reason, if I attempt to short this market, I will be doing so in several tranches, with getting more aggressive on a CLEAR 5-wave decline after a wave 2 tops out.
But, because of the lack of clear structures, I have to still maintain an alternative count with the potential that we can get to the 2995-3011 region in a 5th wave of an ending diagonal structure to complete a 5-wave [c] wave to this b-wave. Yet, I have to view the b-wave as having completed as my primary count at this time, but not by a huge disparity in probabilities.
Now, let me address the leading diagonal down. One of the points made by Bob Prechter in his writings is that triangles and diagonals often take more time and subdivide into more structures than we initially view as completed. That would suggest this leading diagonal down has not yet completed, and has another decline, as shown in grey on my 5-minute chart. If you have been following Garrett’s analysis, this is how he specifically has been following this leading diagonal to the downside.
For now, I have shifted my primary count to the b-wave having topped. Again, I want to note that I cannot say that the probabilities heavily favor this shift based upon the issues I have outlined above. But, I would view it as more likely than not at this point. In fact, while Bayesian probabilities still calculate the topping structure we are developing is a b-wave to a 70% probability, whether the top has been completed is only at a 60% probability, which basically confirms my analysis regarding how I view the structure being more likely than not, but not strongly favoring the top is in yet.
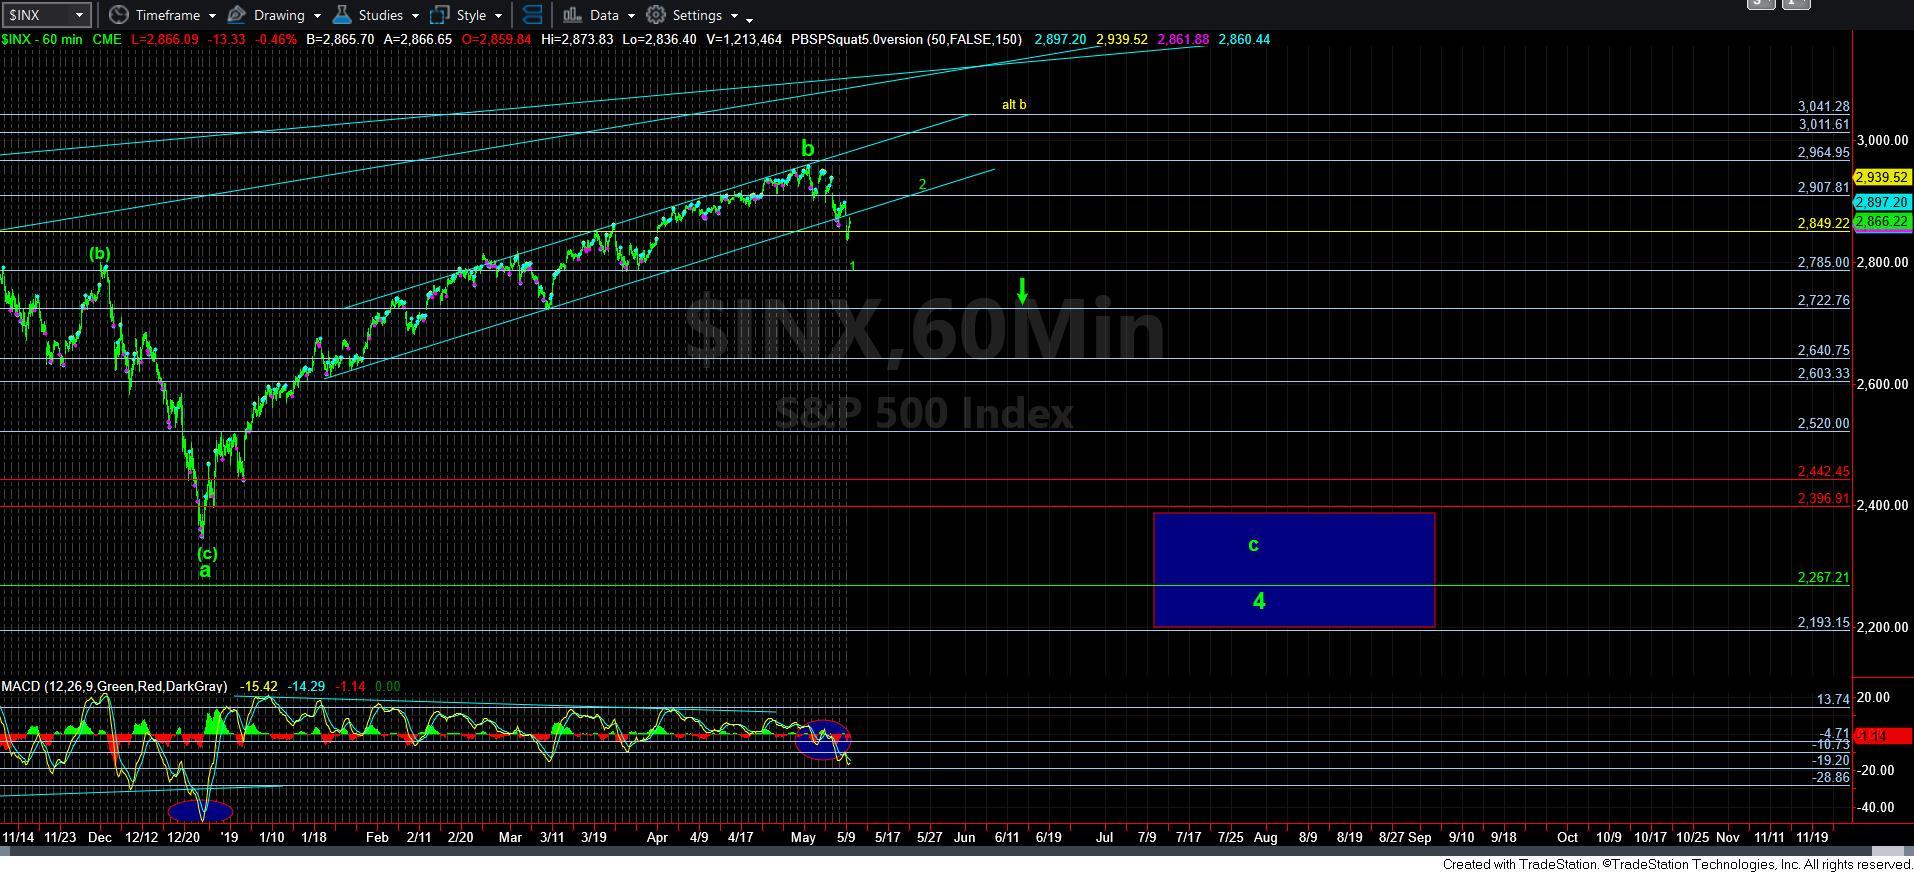
For this reason, my heavier shorting positions will not likely be struck until we have the 1-2, i-ii downside structure in place, and the wave iii of 3 has triggered. And, clearly, I will be tracking the structure in the coming week. Once that structure develops, I will again highlight the “trap door” region, which, when broken, will signal the bigger decline has likely begun.
So, as the market structure continues to subdivide into the end of the day, I may be following this analysis up with an addendum for today, especially if further action provides more clarity. And, most specifically, I am going to try to find confluence for another topping zone for a wave 2 as the market structure progresses. What I will be looking for is an a-b structure which projects a c-wave into one of the Fibonacci retracement levels. For now, I do not have enough information to perform those calculations just yet. As we develop, I will continually update it.
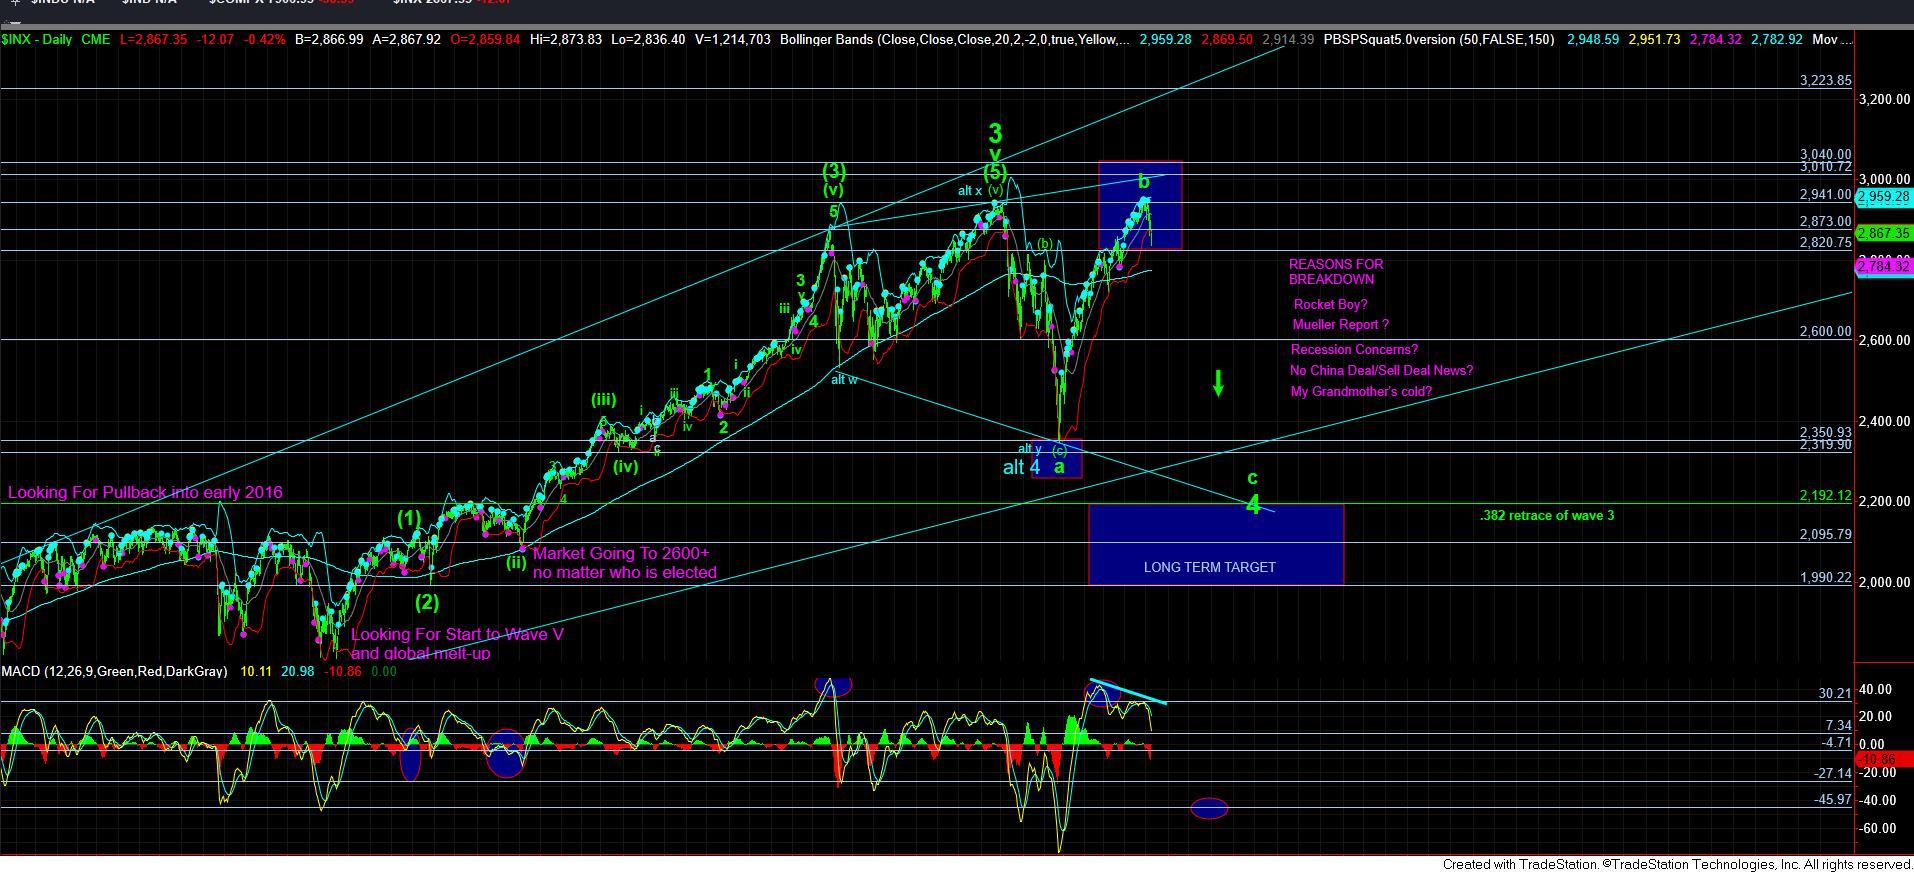
There is one last point I would like to make from the attached charts. If you look at the MACD on the daily chart, it has been the strong indication that this market was likely in a topping formation, and I have been highlighting that recently. Moreover, I have placed an ellipse as to where the MACD will often drop down towards in its larger degree declines. In fact, most larger degree bottoms are not developed until the MACD at least gets down into that region. Currently, we are still quite far from those levels.