Primary Perspective Is Still Wave [2]
With the market pushing past the 3750ES region, it has made the ending diagonal I was initially tracking extremely unlikely, but that does not mean that wave [2] has yet completed. So, until proven otherwise, I am still maintaining the primary perspective that wave [2] is still ongoing.
As I note time and again, corrective action can take many twists and turns, which makes them very different to trade. But, there is a significant benefit in understanding that we are still likely within a corrective phase, as it allows you adjust your trading and expectations when you know you are within this type of environment.
But, the question remains as to where we are within this wave [2] if it is still ongoing?
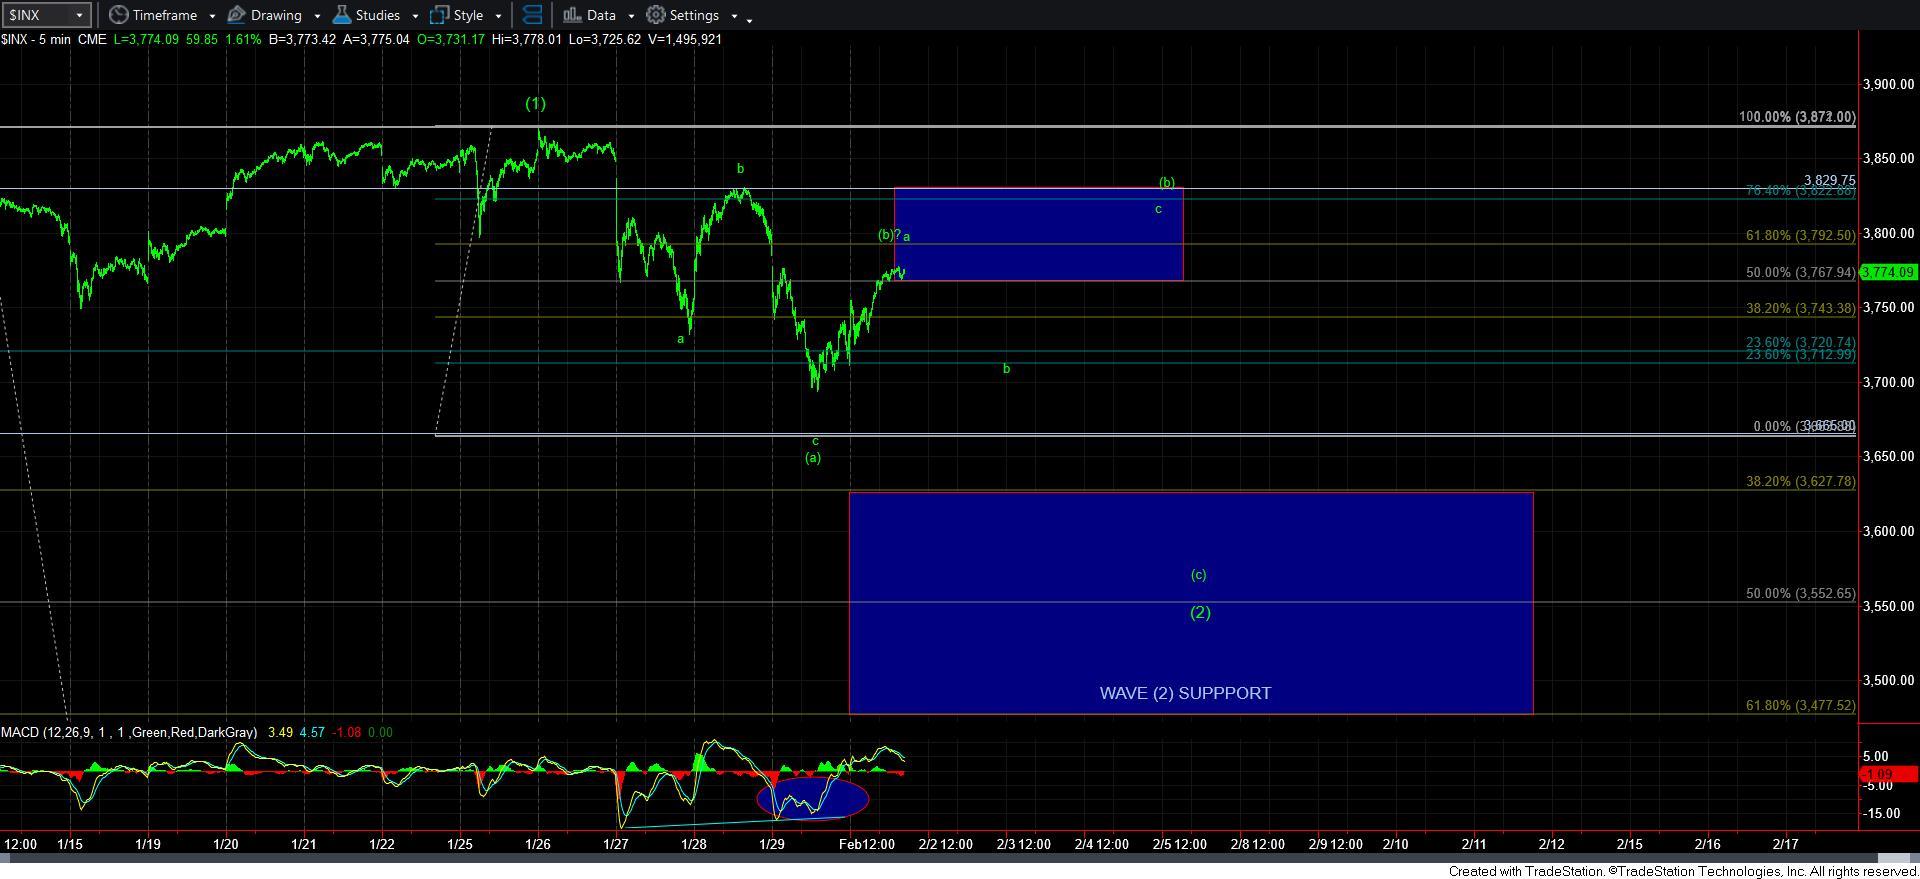
Well, if I would give you my ideal preference, I would probably suggest you review the a-b-c structure in green on the attached 5-minute SPX chart, which would suggest we can spend several days within a [b] wave within wave [2]. But, as I said, there is no set pattern within corrective structures, so it is entirely possible that all of the [b] wave is completing with this rally. But, the more preferable path would be for it to take more time and provide us with a “fuller” [b] wave.
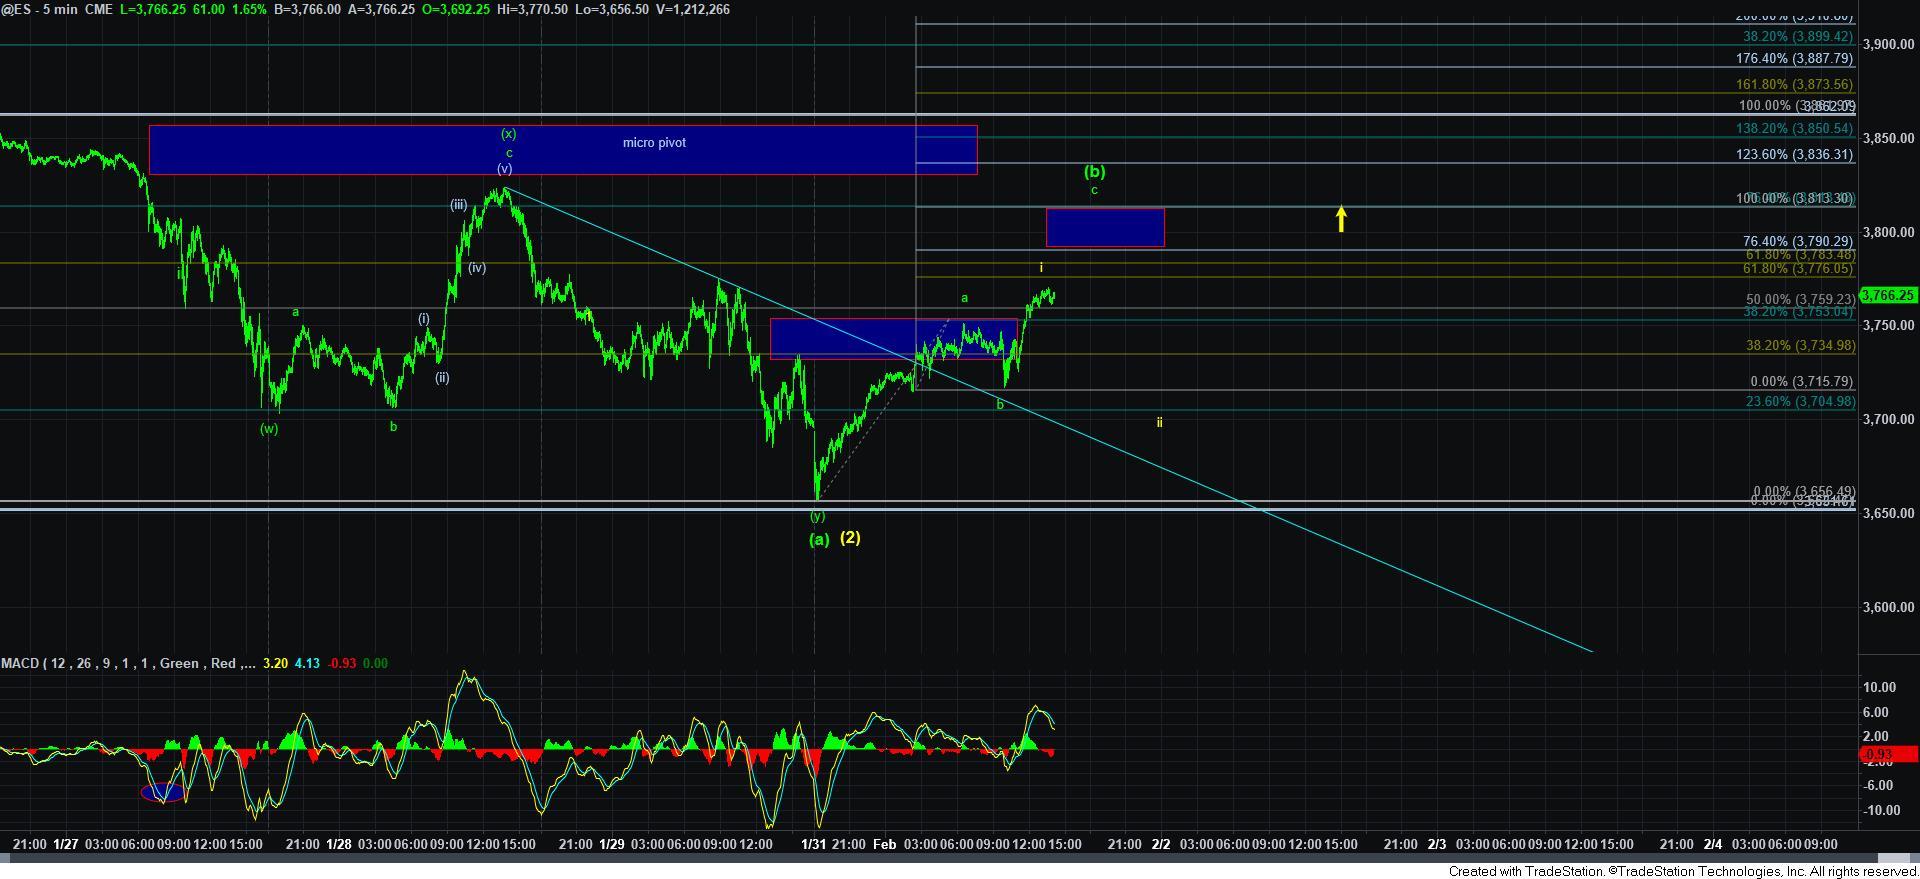
Now, since we are still likely within a bull market, I have to maintain a healthy respect for the potential that wave [2] MAY have completed. That count is shown now in yellow on the 5-minute ES chart. That would suggest that we are completing wave i of 1 of [3], with a wave ii to be seen into tomorrow. But, as I said, the market is going to have to prove this to me, and it will likely take us several more days before the market will begin to do so.
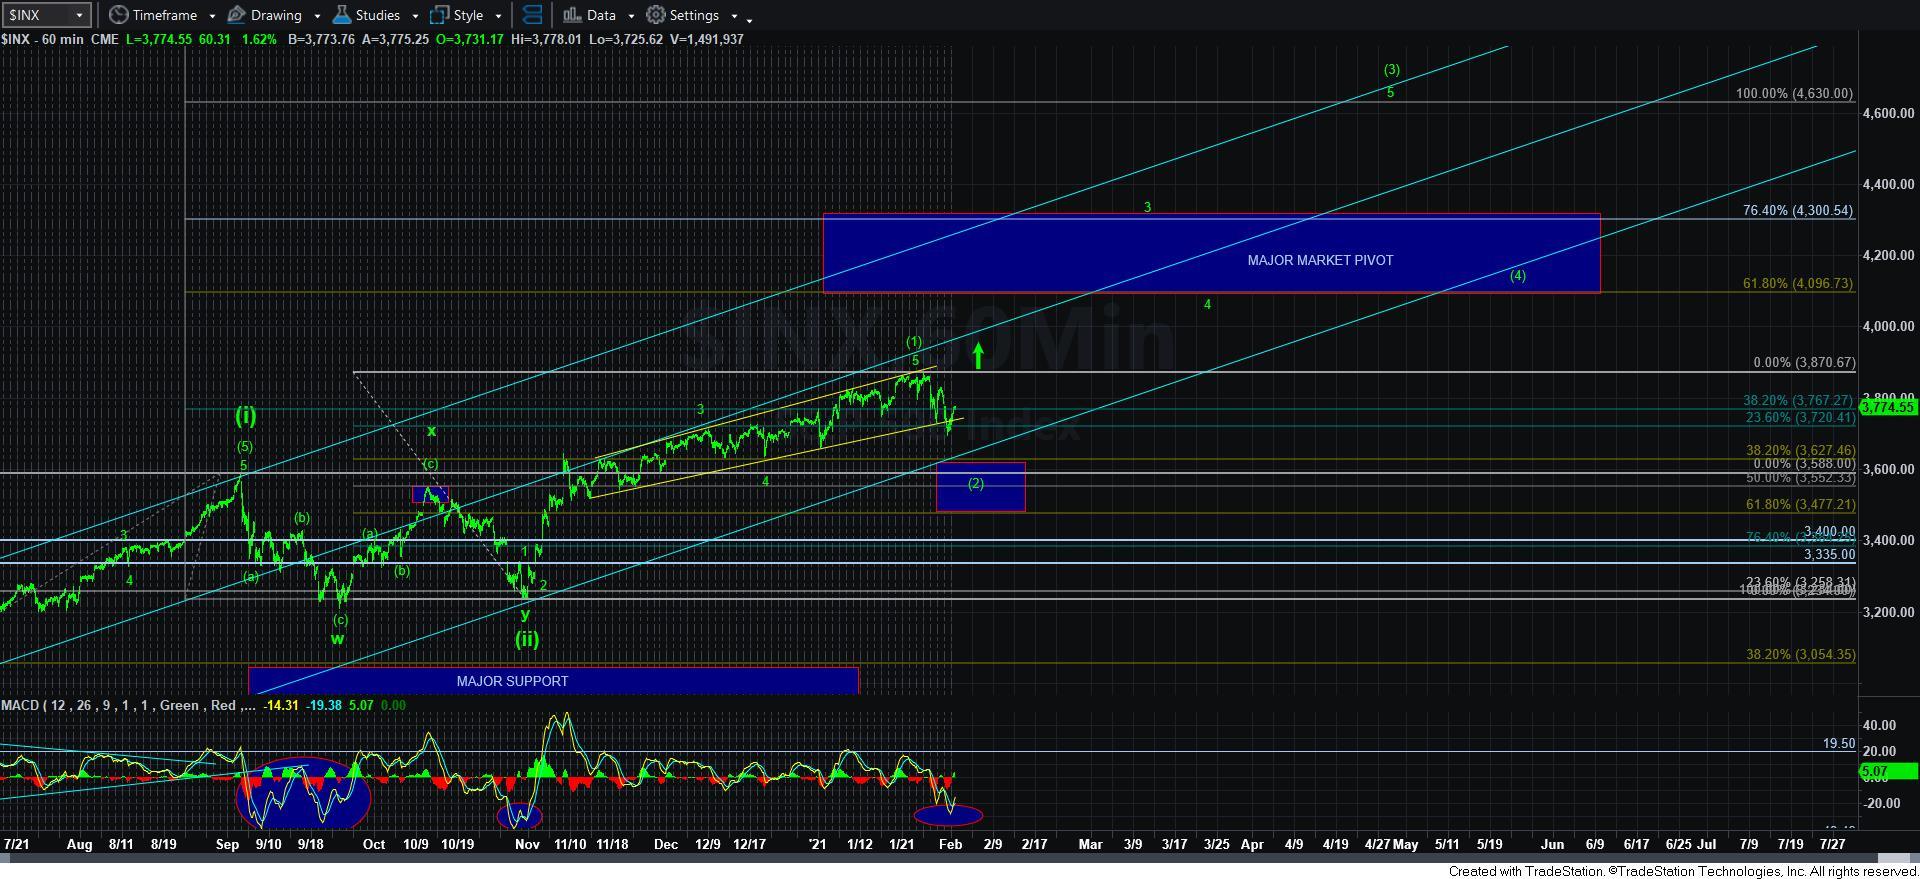
But, keep in mind that you will not likely be missing too much upside in allowing the market to confirm a shallow wave [2], as our general wave 3 of [3] target is between the 4100-4300SPX region (depending upon where wave [2] actually bottoms), and wave [3] of [iii] will likely be targeting the 4600SPX region later this year. So, I am going to give the market a bit more room to provide us more of a wave [2] pullback, but that will not be a long leash, as the market is now almost as oversold as it was when wave [ii] completed in November.
And, even though the ES may have a 5-wave potential structure off its overnight low, I simply cannot make out the same potential in the SPX, which also allows me to discount its potential for now. So, the SPX chart still looks well within a corrective structure for now.
In the meantime, 3815ES is the resistance I am watching on the ES, as that provides us with an a=c off the overnight low, whereas the SPX chart would suggest the 3830SPX region is our main resistance.
In summary, we are likely still within a corrective structure within the SPX. That structure may still provide us a few more twists and turns, so it may take another day or two until the micro structure is clarified. Remember, we are in a “jello” regime. And, as long as the market continues to take shape in a corrective fashion, I am still looking for one more drop to our wave [2] target below.
In the meantime, I am going to be very carefully watching the ES chart to see if we get a more impulsive structure developing off the overnight low, which would tell me that we have to switch gears sooner rather than later. In the meantime, you should still be focusing upon individual stock opportunities, as noted over the weekend, until the market makes it VERY clear that wave [2] is over and that wave 1 of [3] is in progress. And, don’t be in such a rush to get very aggressive with the market yet, as you need to keep in mind that wave 3 of [3] is the real prize upon which you want to be focusing.