Price Action Is Still Sloppy, But A Bottom May Be Close
 By
By
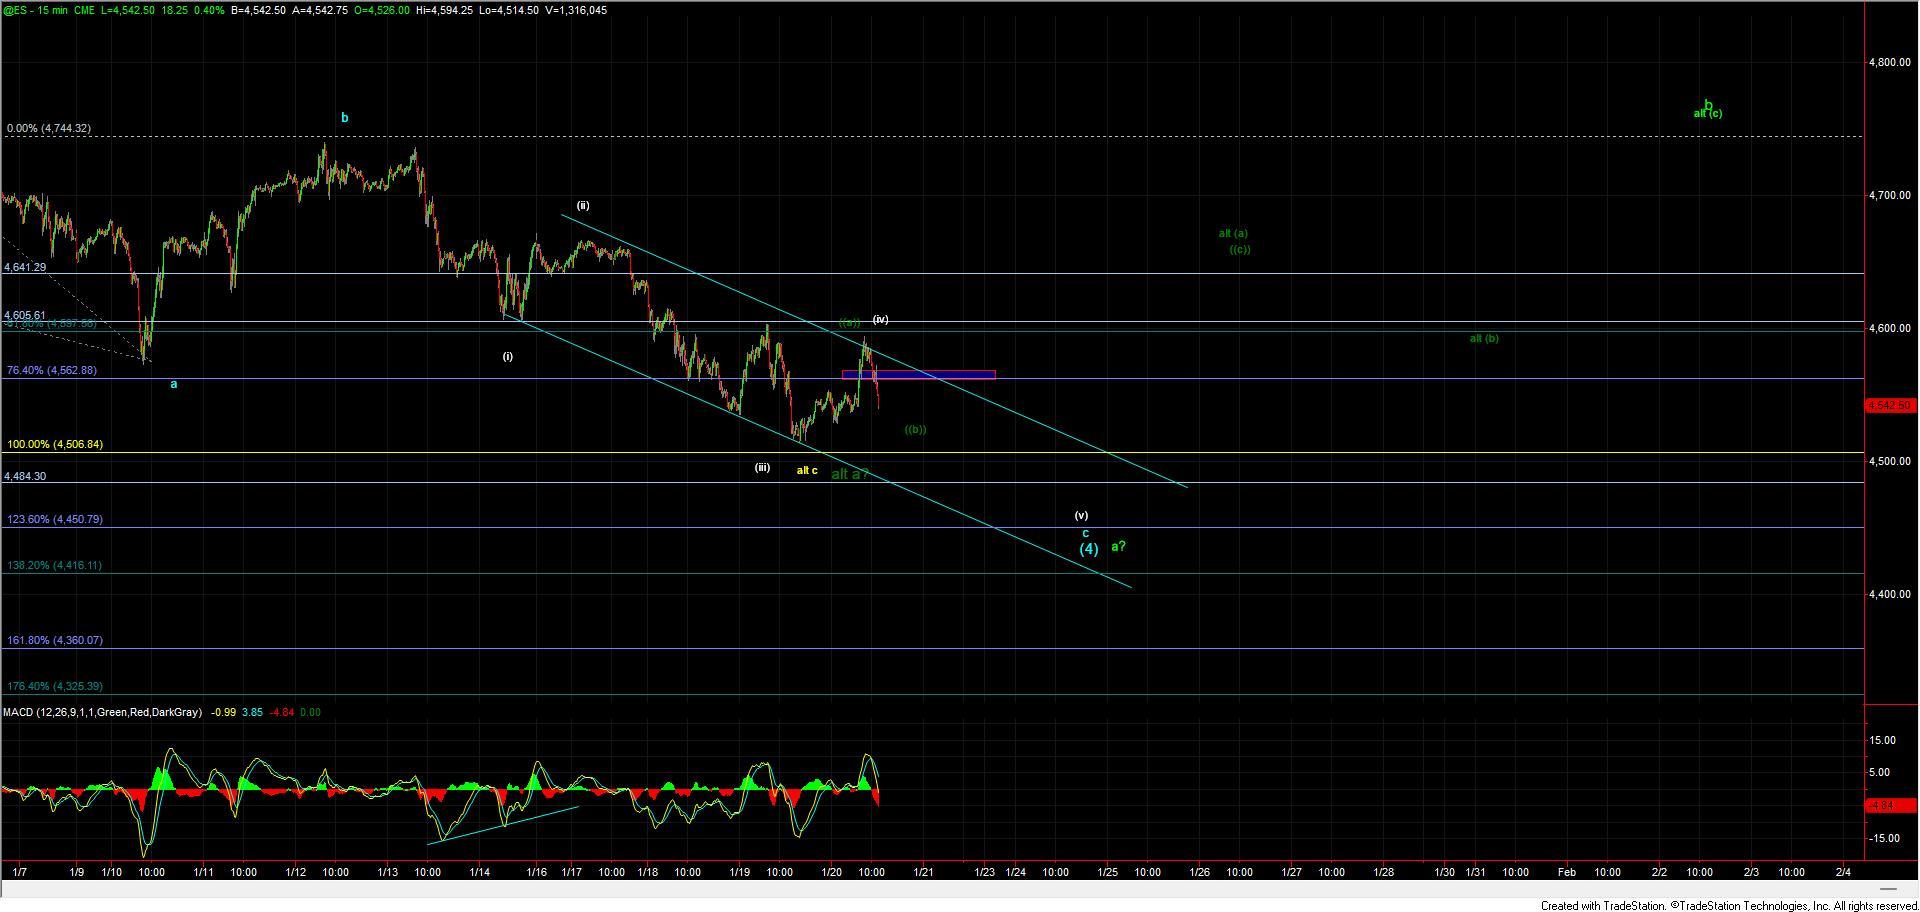
Overnight we saw the market push a bit lower from the close that was struck yesterday which was quickly followed by a push higher in the pre-market and early morning trading sessions. The afternoon session saw the markets fail to see a strong and sustained follow-through to the upside leaving us with what is looking like a corrective push higher off of the overnight low. This pattern off of the lows is still leaving the door open to a number of possibilities thus keeping in theme with our Sloppy Fourth Wave Pattern. I am going to do my best to try to keep things as simple as possible in what is a very complex pattern but I do need to layout a number of paths that this may take to ensure that we are not caught off guard during what continues to be very messy price action.
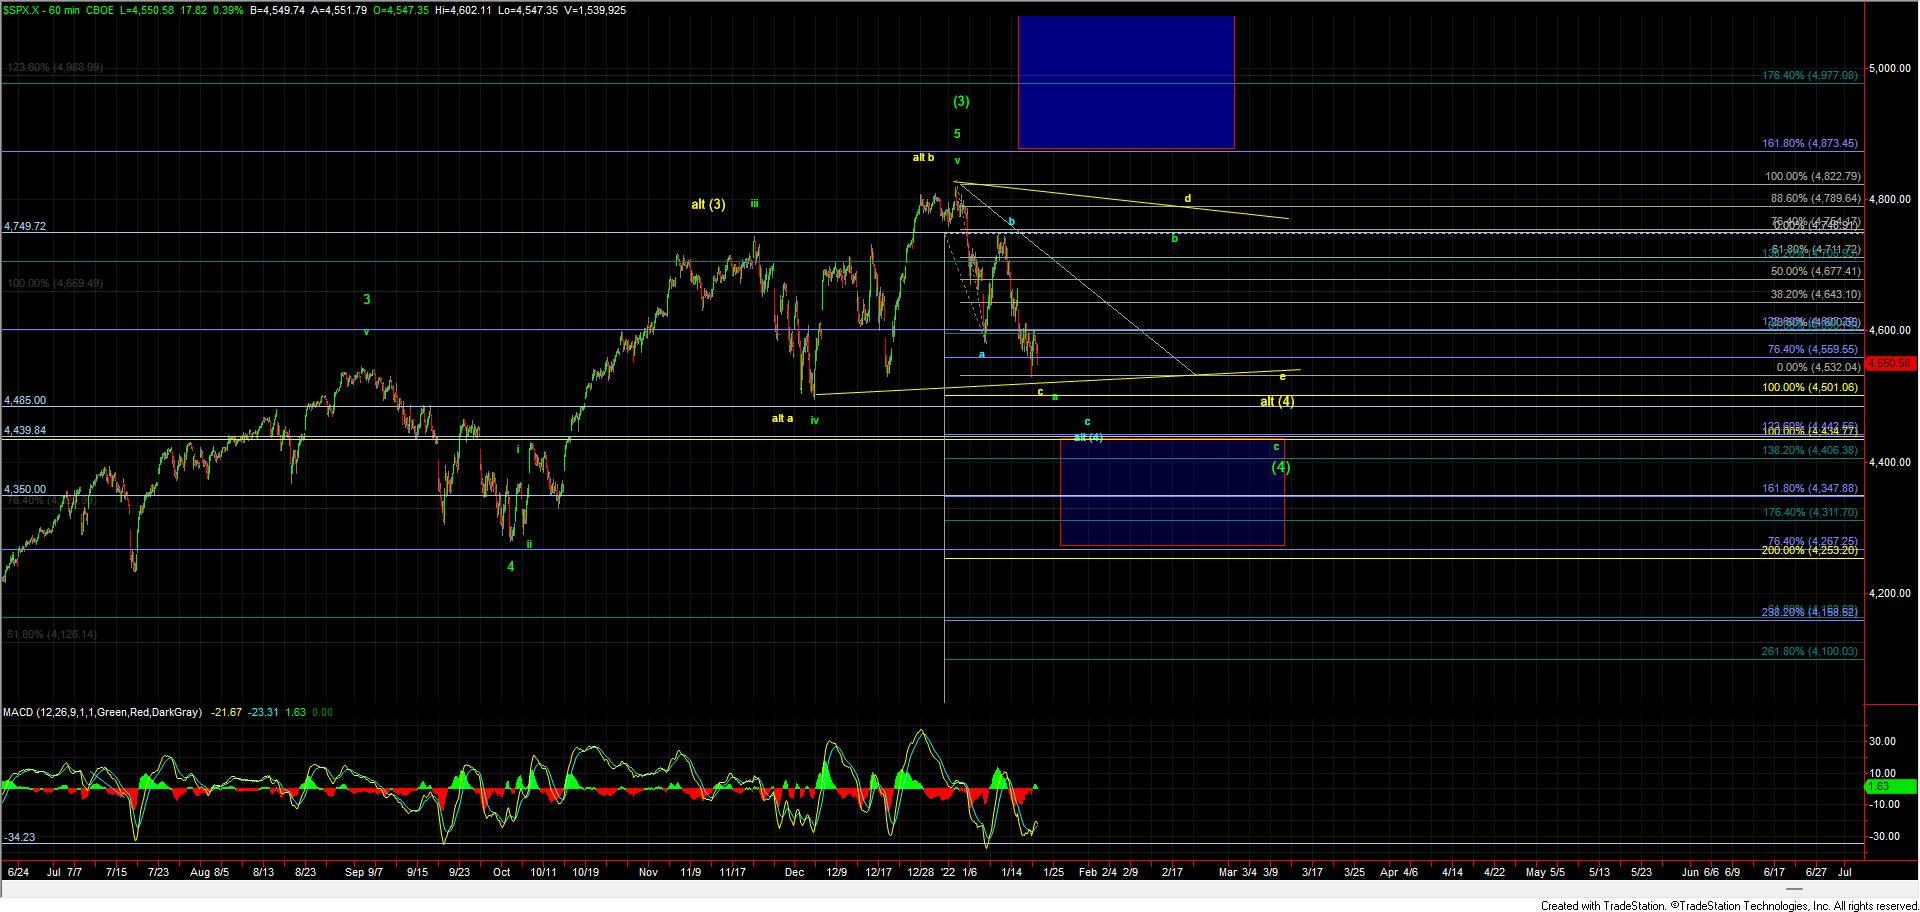
Starting with the bigger picture count as shown on the 60min chart we are watching three possible paths at this point in time, green, light blue, and yellow. The blue path is simply a variant of the green path and the yellow triangle path is unchanged from what I noted in yesterday's update. The green primary count is suggestive that we will see a standard ABC down to fill out the wave (4) and this part is not terribly complex. How this ABC corrective pattern within the wave (4) subdivides is where the complexity arises.
We are currently showing the green path to be nearing a bottom in a wave a of a larger ABC down towards the 4434-4253 support zone. Under this case, we would expect to see a wave b push higher followed by a wave c of (4) down to that larger degree support zone. The blue count, which again is simply a variant of the green path, would suggest that we will see more of a direct push lower towards that 4434-4253 support zone thus finding a bottom in all of that wave (4) more quickly. The yellow count of course is a larger triangle wave pattern and would suggest that we are forming a bottom in the wave c of that triangle and still need another wave d and e of (4) before we can call the fourth wave completed.
From a technical perspective, the market is quite oversold in these regions and we are beginning to form positive divergence on the smaller degree timeframes charts, so for that reason, I think it is reasonable to expect that we are near or have already formed a local bottom in that wave a per the green path. Zooming into the smaller timeframe charts however I do think that the pattern down off of the 4749 high would look better with another lower low before that bottom is found. So for this reason my base case is that, while nearing a bottom, I prefer to see this make another lower low under the 4532 SPX level before a sustained bottom is found.
If we can indeed see that lower low then from there we still will have to contend with the blue and green patterns, but in either case, it is likely that we will see a strong and sharp rally back up towards at least the 4749 high before any new lows are seen again. If the structure off of that low can manage to take the shape of a full five-wave move then we can begin to look towards all of the wave (4) being in place per the blue count. But again let's not get too far ahead of ourselves and first see if we can manage to make another push lower followed by a strong reversal back towards the 4749 level. If we can see a move into that 4749 level then from there we can analyze the pattern and make a better determination as to which path is becoming more probable.
So in summary, while the market may not have yet found a bottom as long as we can remain over the larger degree support zone as laid out on the 60min chart the pressure will continue to remain up on the bigger picture chart, it just may take a bit more time before this is ready to finally being the next push to new all-time highs as this fourth wave continues to work itself out. We should however see some shorter timeframe tradable opportunities develop over the week for those with shorter time horizons. Those with longer time horizons may need to be a bit more patient but as long as we continue to hold the larger degree of support can also view these pullbacks as buying opportunities.