Pressure Still Remains Down
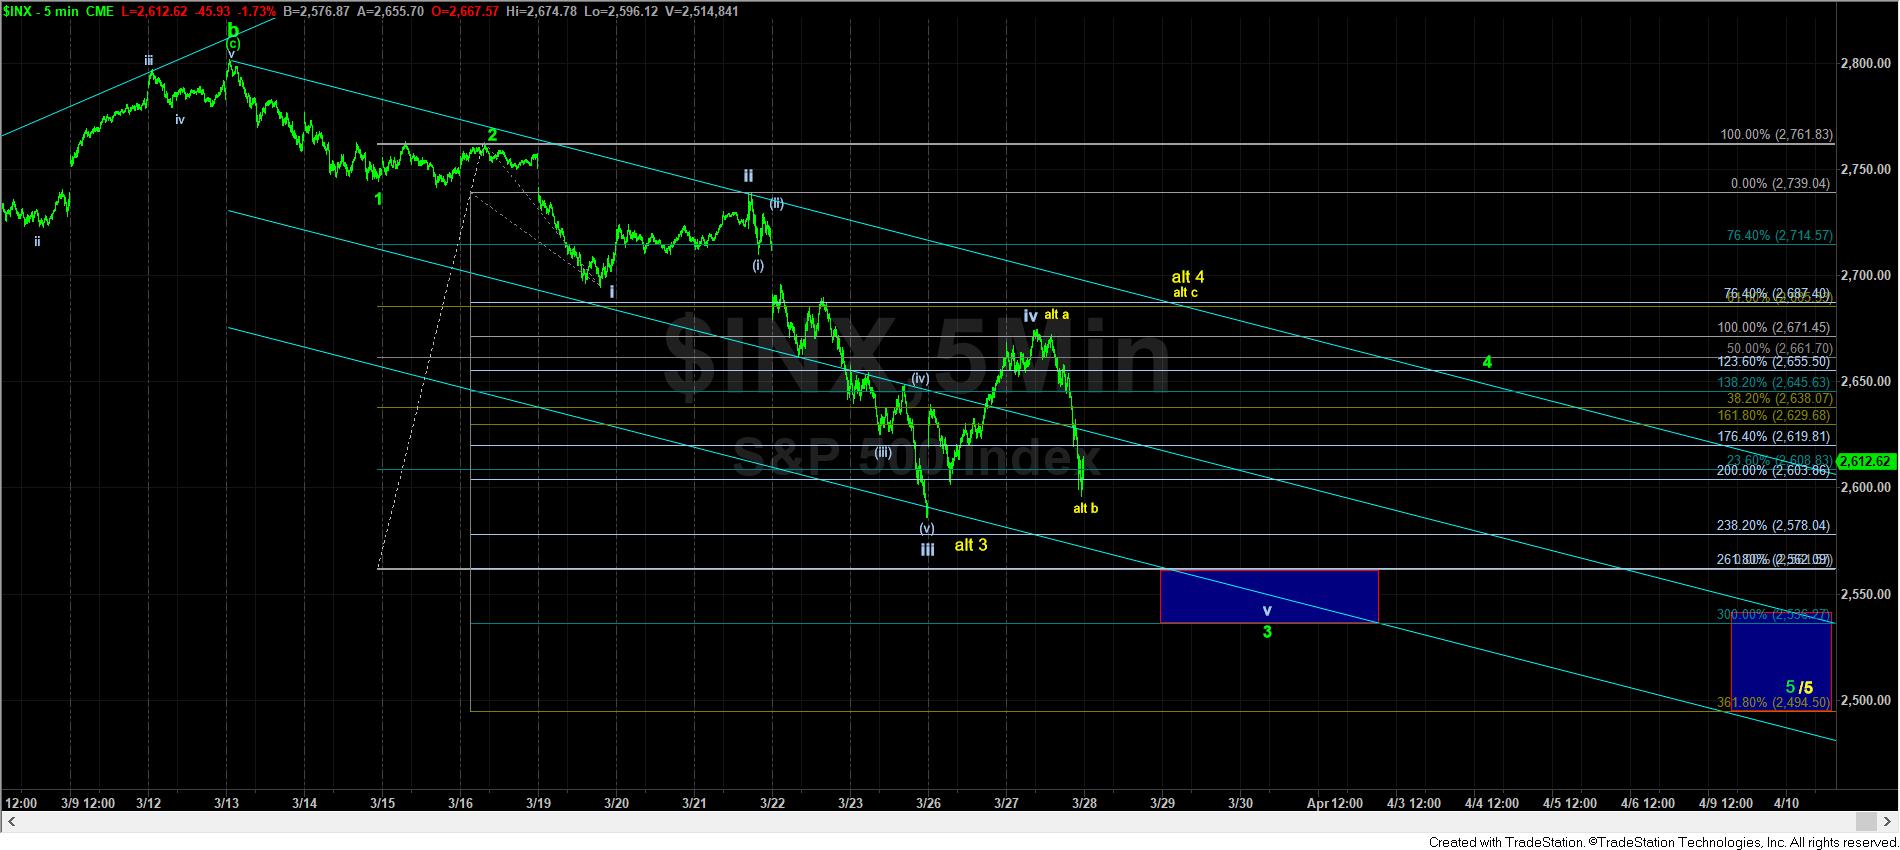
As we were at the highs for the day, I posted several updates this morning explaining that we needed to break below 2650SPX, which will then open the door to drop down towards the 2600SPX region. And, if you were following closely, you would also know that I was noting that if we were not able to see a sustained break below 2590SPX, the market left the door open for another strong rally for the next two days back up towards the 2685SPX region in the yellow 4th wave count. Today’s low was 2596SPX.
Normally, a 4th wave will provide a c-wave as a standard 5 wave structure. Unfortunately, the significant whipsaws we have seen of late are making this much harder to count as a standard 5-wave structure. And, tomorrow will likely tell us if we are going to maintain a standard – but stretched – 5-wave structure, or if we will be moving solidly into the ending diagonal pattern presented in yellow.
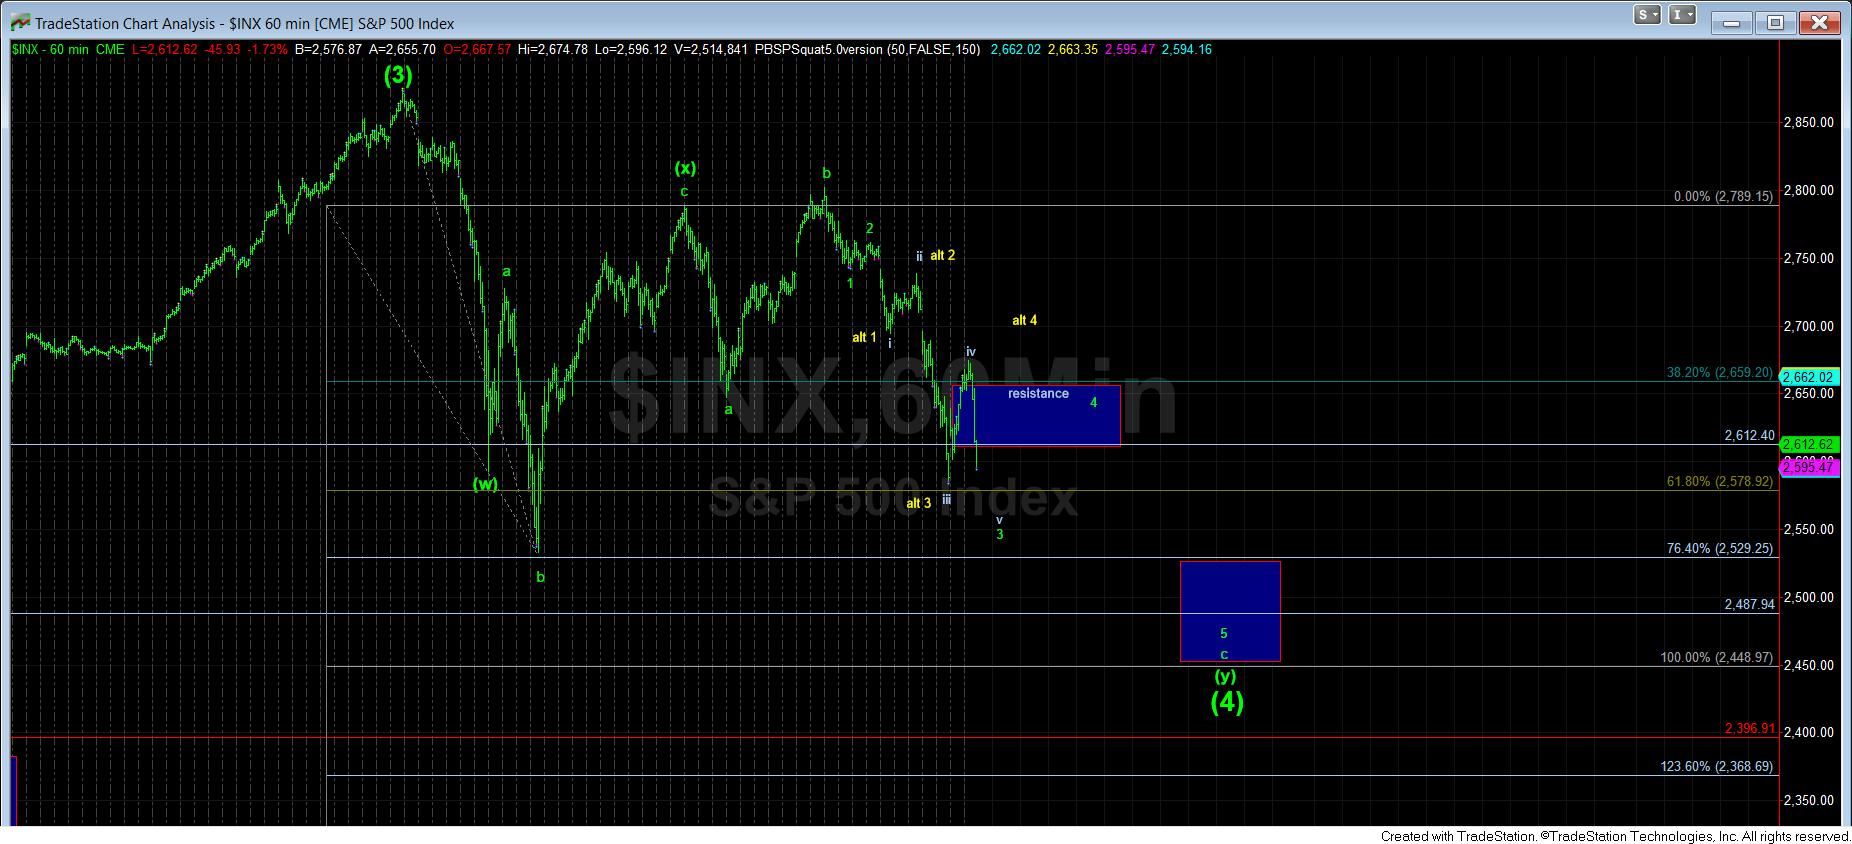
As we saw today, the market pushed just a bit beyond our resistance for a wave iv, and even though we did see a bit higher than 2660SPX, I still maintained the high today as a wave iv of 3, which was reiterated throughout the day. But, it means we will need to see downside follow through overnight and into tomorrow towards the 2530-2560SPX region to complete wave v of 3.
But, again, if the market wants to really cause the most havoc possible, that yellow count would be quite evil as it would take us back up towards the 2685SPX region for a more protracted 4th wave structure. In fact, 2685SPX is where a=c, and it actually resides right where the downtrend channel is hitting at the end of this trading week (which is shortened due to Friday’s Good Friday closure).
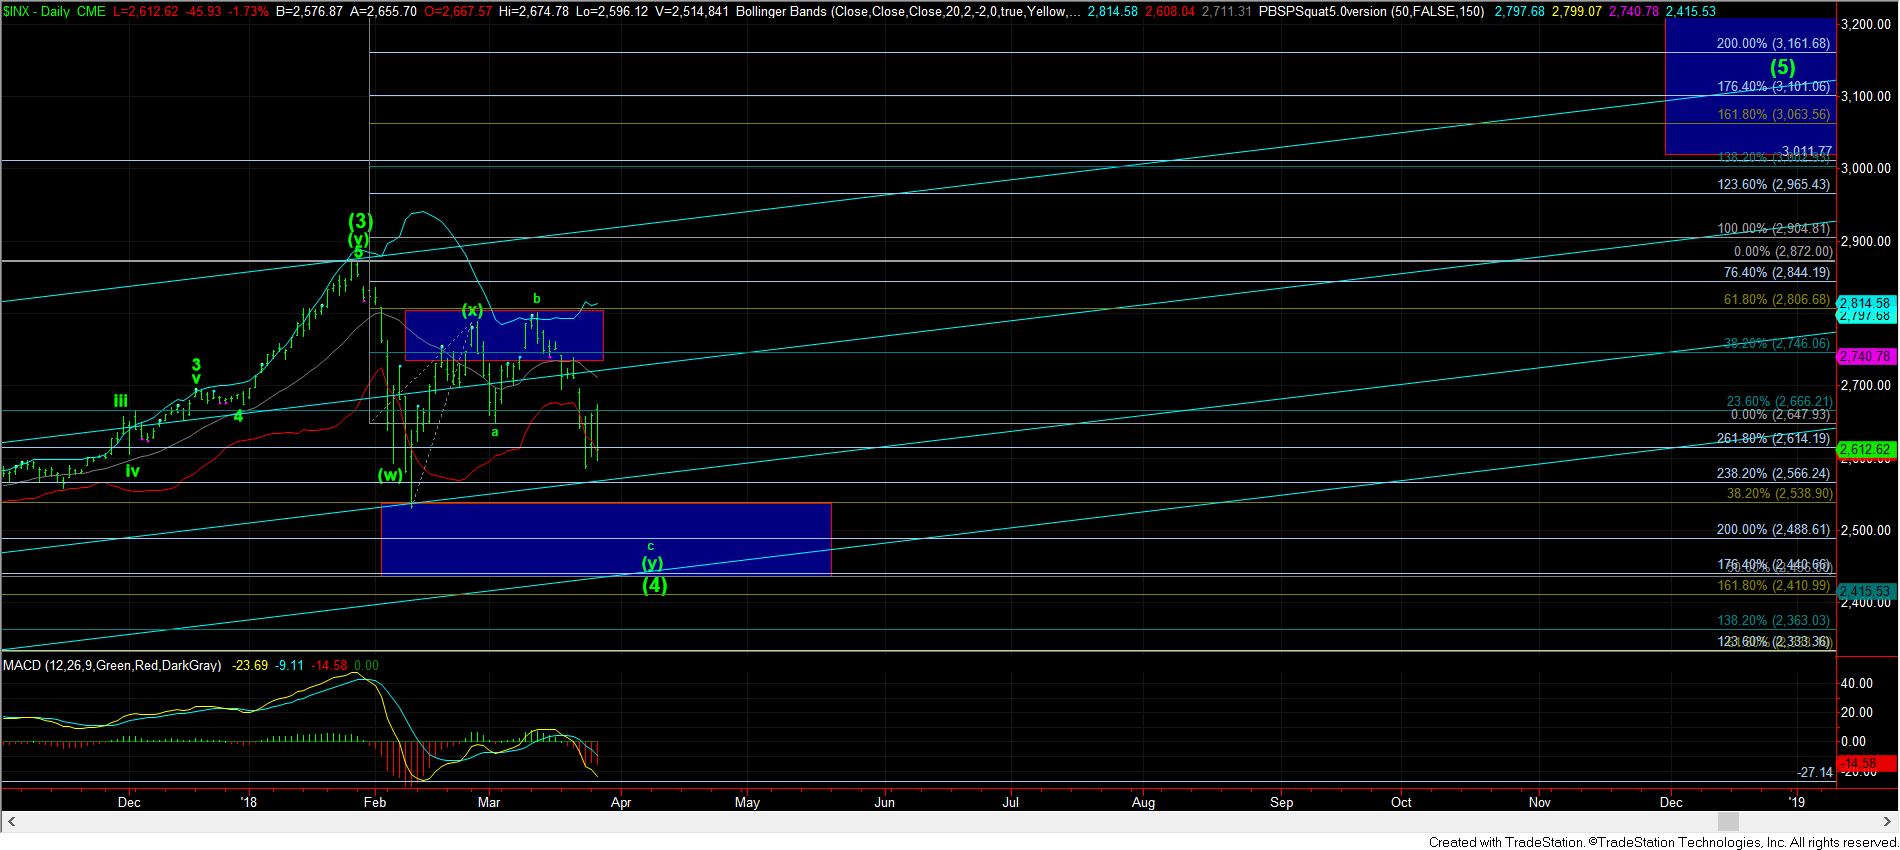
Interestingly, under either of the structures for this final segment of the decline, it does not look like we are projecting down towards our ideal target in the 2450SPX region. In fact, as it stands now, it looks like we may come up short. So, depending on how the market plays out over the coming week, it is certainly possible we may not be able to break below 2485, and there is even potential we may not even break below 2530SPX. But, we will have to see how we develop over the coming days to get a better handle on that.
What I am really liking so far is that we are setting up the positive divergences we normally see in a c-wave, as relative to the a-wave. Both on the daily and chart and the 60-minute chart, the MACD seems to be setting up a bottoming structure to provide us with a nice positive divergence on this final leg of wave (4), which is exactly what we want to see as we are completing this segment of the correction.
So while the jury is still out right now as to EXACTLY how we test the 2530SPX region again, tomorrow will likely tell us if it will be following the green wave structure, or the yellow wave structure. But, either one is still pointing towards a retest of the 2530SPX region at this time. The only difference is if we see a bounce to 2685SPX before we drop to 2530 (yellow), or a bounce back towards 2650 before we drop to 2530SPX (green).
So, my expectation remains that we have not yet completed this wave (4), and as long as we remain below 2685SPX, I will maintain the expectation of a retest of the 2530SPX region.