Pressure Remains Down as We Approach the Next Downside Pivot
 By
By
After moving higher in the morning session, we saw the market move lower in the afternoon session and break the low that was struck yesterday. This is keeping the pressure down in the equity markets, and as long as we continue to move higher in a corrective fashion, this pressure should continue to build to the downside. With that being said, there are still two viable bearish paths that I am viewing as likely. How the market moves through the Fibonacci levels in the days ahead will help differentiate which path we are following if we are indeed heading lower.
I do want to warn, however, that although my base case remains bearish, we are still over the lower end of bullish support that has the potential for the market to turn back toward new highs. Under that scenario, however, I would need to see a full five-wave move higher while holding that support to make that path more likely. Unless and until that occurs, the pressure will remain down in the equity markets.
WHITE COUNT
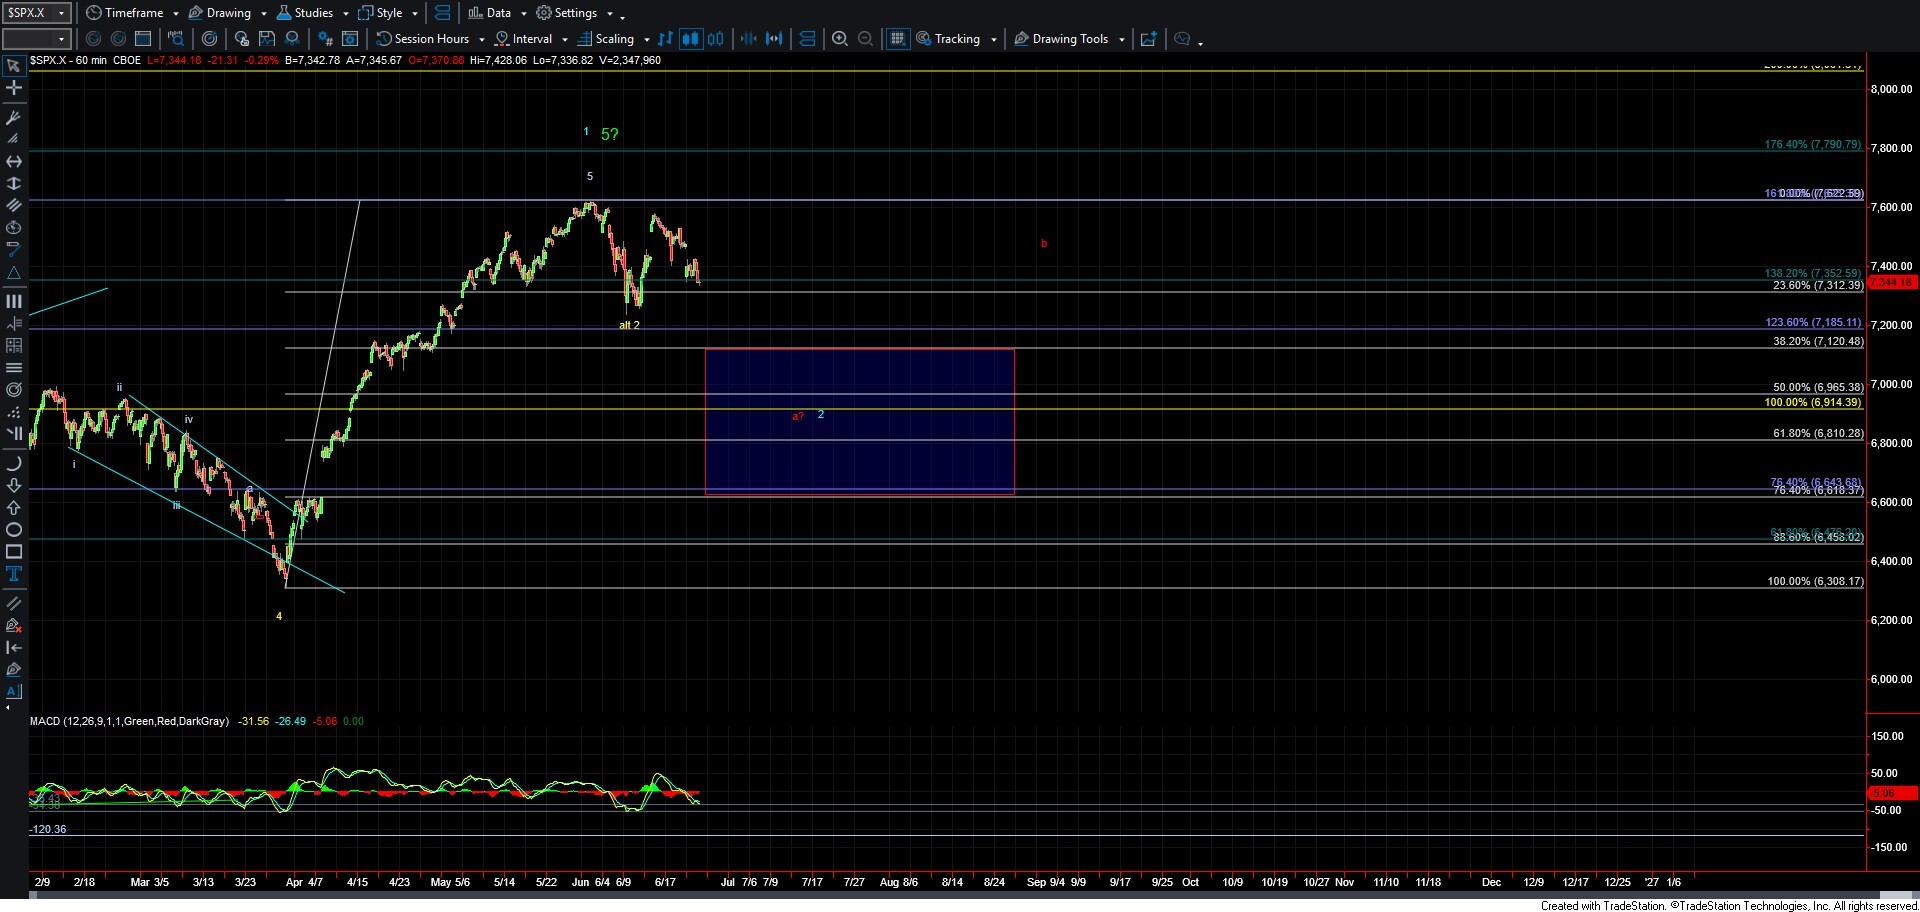
This is the first of the two bearish paths that I am watching and the one that I will call my primary count. I will note, however, that I am only slightly leaning toward this count over the red count, but for now it will remain the primary count.
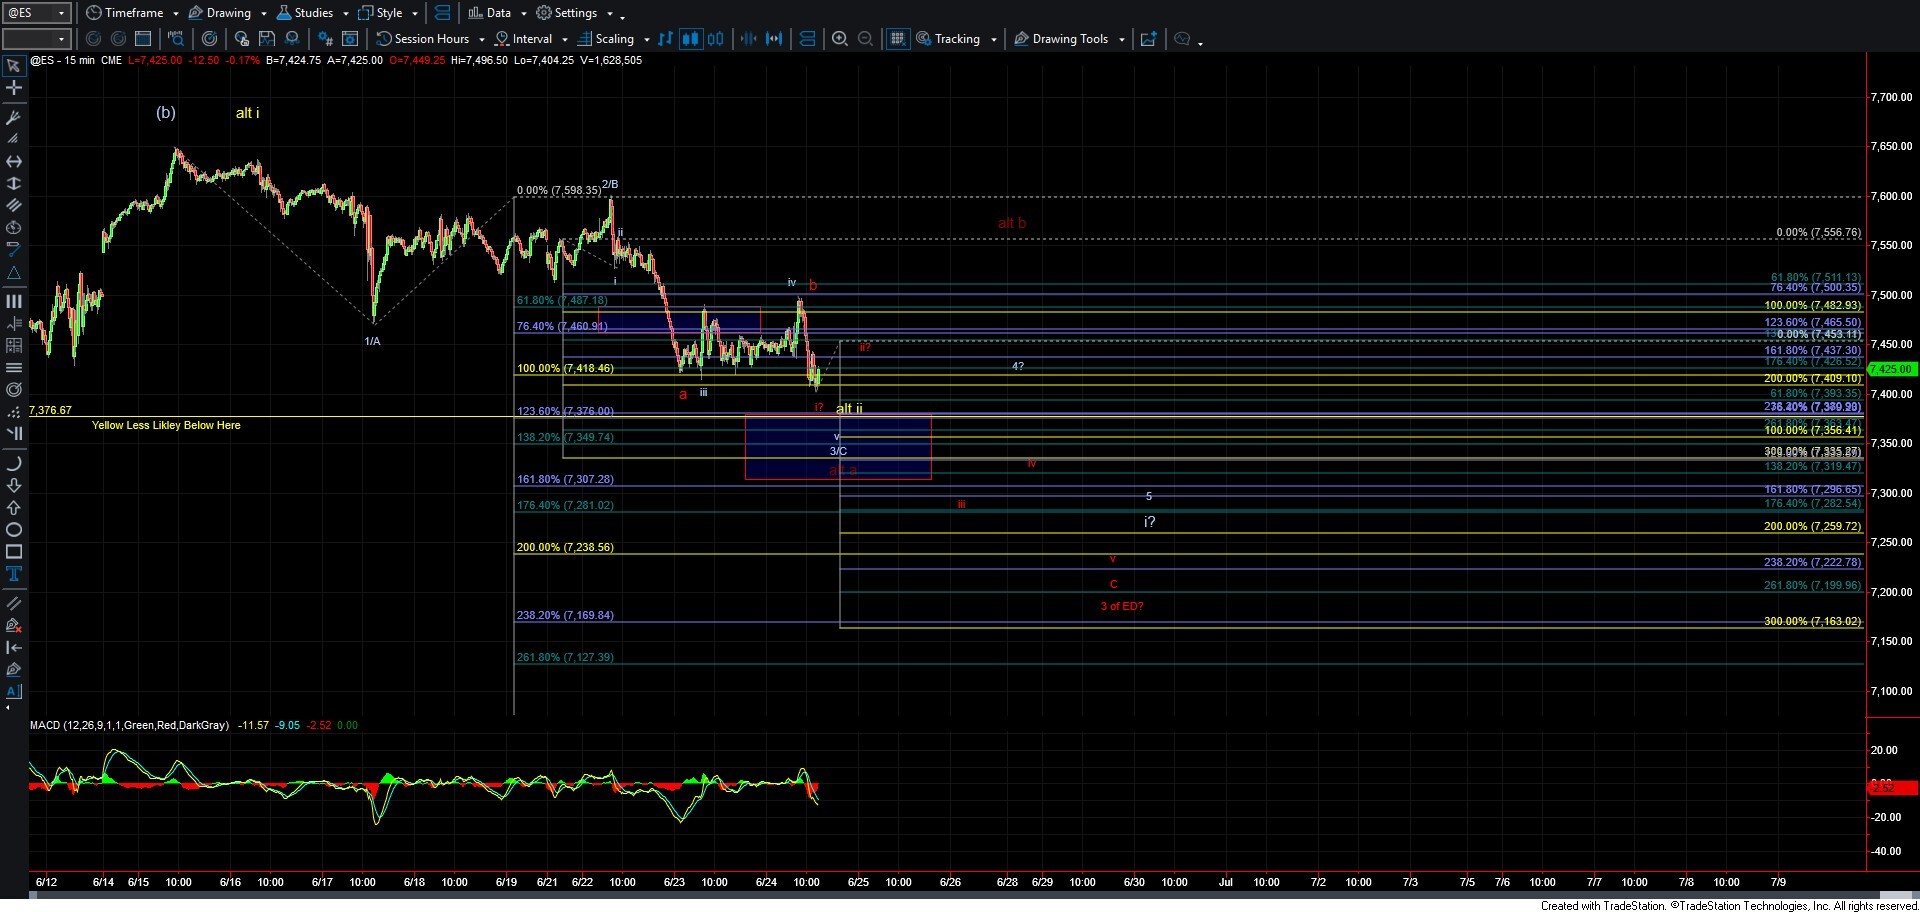
Under this case, I would want to see the market continue a bit lower toward the 7376-7349 zone to fill out wave 3/C as shown on the charts. From there, I would want to see a corrective retrace higher for wave 4, holding under the 7418 level, and then make one more lower low to finish off wave 5 of i of larger wave (c) down. From there, I would want to see a corrective retrace higher for a larger wave ii, setting up a bigger drop in the weeks ahead for wave iii of larger wave (c) down.
RED COUNT
This count is a bit more immediately bearish and would likely be part of a larger Ending Diagonal for wave (c) down. Again, while the white count is my base case for the time being, if we end up retracing from around current levels, hold under today's high of day (HOD) at 7496, and then break sharply lower, this count would likely become my base case.
Under this scenario, any retracements should remain corrective in nature and hold under today's HOD at 7496, followed by a sustained break under the 7376 level below. If that occurs, we can further lay out downside targets, but I would expect to see this move down toward the 7300-7169 zone on the ES before the pattern is completed.
I also want to point out a variant of this red count that would suggest we are bottoming in a larger wave a at today's low of day (LOD), under which case we could still see a larger wave b retrace higher. I am viewing this as a lower-probability outcome for the time being, but I do want to point it out should we see the market break back over the 7500 level on the ES in a corrective fashion.
YELLOW COUNT
Finally, the yellow count would suggest we are approaching a bottom in all of wave ii, setting up a push to new highs. I have several issues with this count, so it is very much an alternate count at the moment, but if the market starts to move higher in five waves, the door is still open to this possibility.
I would want to see that five-wave move begin while holding over the 7376 level on the ES, as this is the 76.4% retracement level of the move up that began on 6/10. As long as the market continues to move higher in a corrective fashion, however, this count will remain an alternate path forward.