Pressure Remains Down For Now As The Market Trades Under Resistance
 By
By
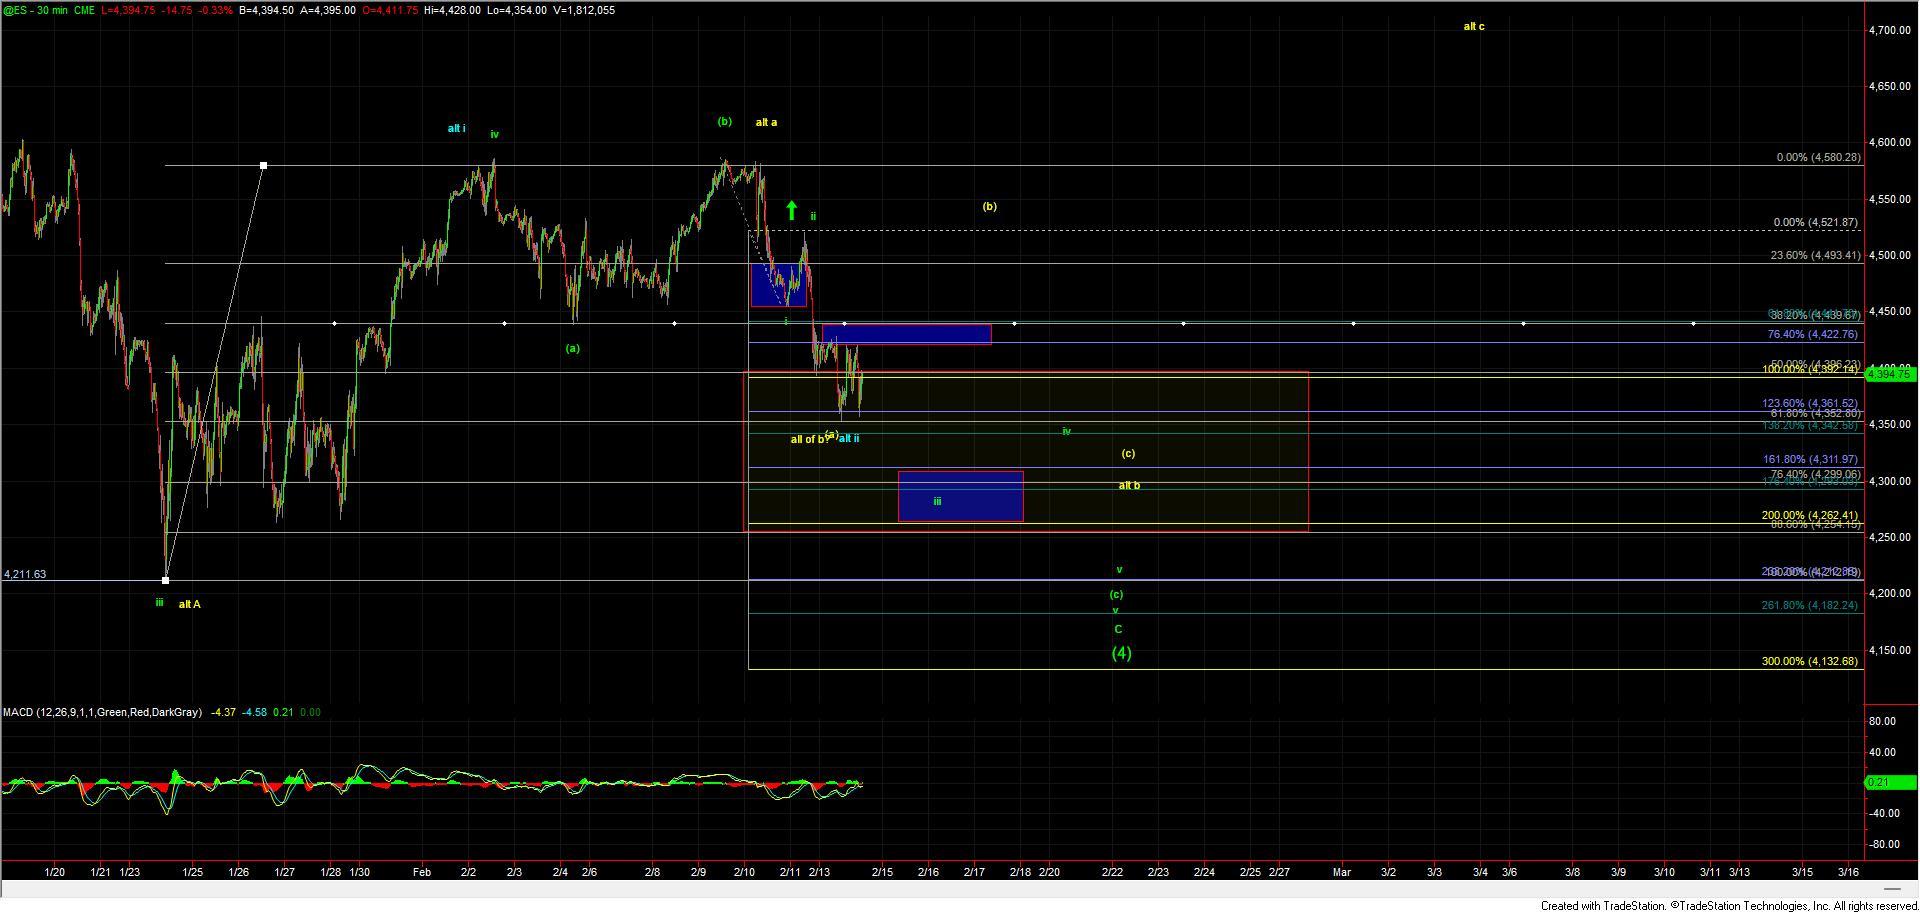
Overnight the ES broke down lower and pushed under the 100ext of the initial move down off of the highs which I had laid out in the weekend update as the first key level to break to give us further confirmation that we were indeed following the primary green count lower. We then saw the market bounce up off of the 123.6 ext at the 4361 level before hitting its head on the overhead resistance/pivot zone which was laid out in the 4422-4441 zone. In the afternoon session, the market then reversed fairly sharply off of that resistance level and is testing the overnight lows once again as we move into the final hour of trading. All of these levels are Fibbonnacci pinball price levels and so far this has been following the expected path lower as part of an impulse for the potential wave (c) down off of that high. This is giving us fairly clear parameters to work with and as long as the ES continues to follow those parameters the near-term pressure will remain down. If however, we begin to deviate from the FIbbonaci Pinball parameters and guidelines then we will have an early signal that we are indeed following the alternate path which has been laid out in yellow on the charts.
To not get too caught up in the weeds I am going to keep things fairly straightforward here and follow our Fibboncci Pinball guidelines from eh move down off of the 4580 high. With that as long as we continue to hold under the 4422-4440 zone then the near-term pressure will remain down per the green count. Further confirmation of this green count would come with a break under the overnight low at the 4354 level which should then see this target the 4311-4262 zone below. This should then be followed up with an ultimate pus back down below the 4211 low to finish off the larger wave v of (c) of v of C thus completing our larger degree wave (4) as shown in green on the charts.
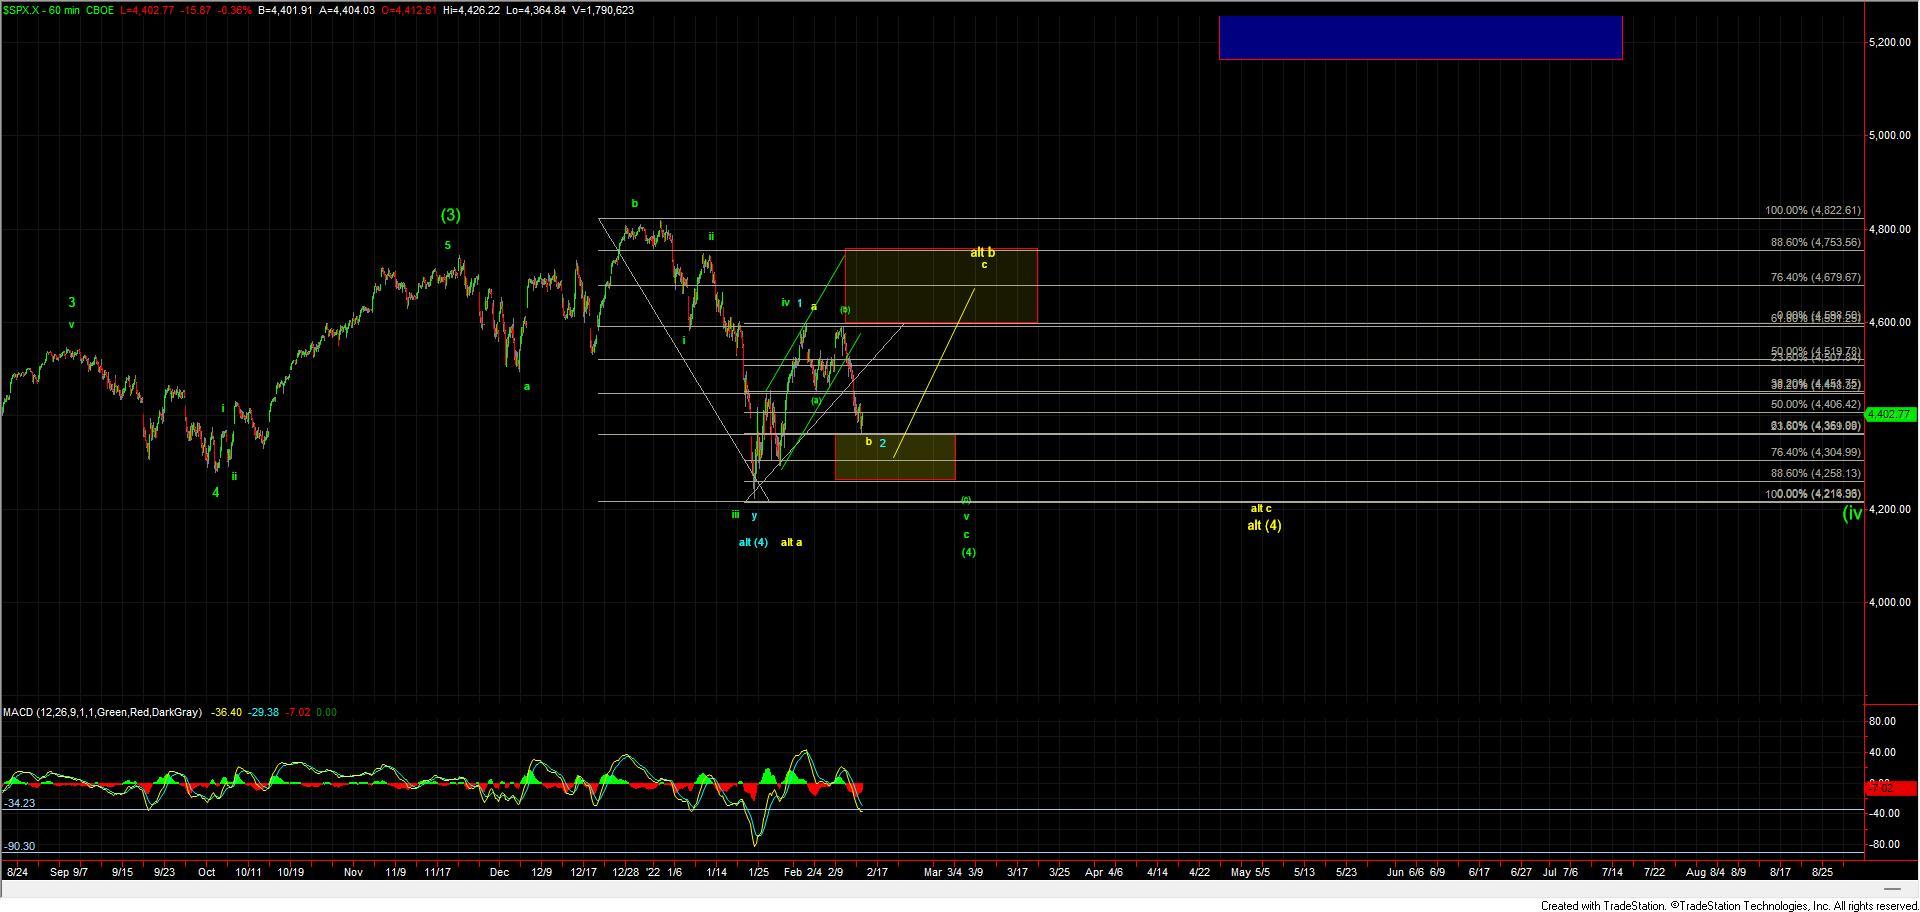
If we are unable to continue to follow-through lower but rather break back over the 4441 level then it would open the door for this to have already bottomed in either all of the yellow wave b (as with this push lower we are now deep enough into the wave b territory to consider this to have bottomed in all of the wave b) or simply the wave (a) of b as indicated on the charts. If we do break higher then the structure of that break will help to determine which of these paths we are indeed following as we would need to see a full five-wave move up off of the lows AND a break of the 4441 level to signal that all of the wave b is indeed in place whereas if we see a break over 4441 but only a three-wave structure then it makes it more likely that we are only tracing out the wave (b) of b as shown on the ES chart. For now, however, and as long as this remains the 4441 pivot level I will maintain the green count as the primary path forward and simply wait to see if this can continue to follow the parameters that are quite clear on the charts at the moment.
So while we are far from being out of the woods here and while I do expect this to still take some more twists and turns because we at least of some clearly laid out parameters for our green count we are situated in a better spot than where we had been last week as we should know in the next couple of sessions whether this will continue to push lower following the primary green path or whether we will see this fourth wave continue to grind us sideways for the next couple of weeks. In either case, the opportunities are still in place based on the zoomed-out larger degree counts which we have been tracking over the course of the past several years.