Precarious Spot For Market
With my prior update from 3 hours ago highlighting the issues as I saw them within the rally we experienced off the Oct. 2 low, I tried to express to you my “feelings” that something was askew. And, now, today’s drop from the high has presented us with several interpretations and places the market in a very precarious spot. Allow me to explain.
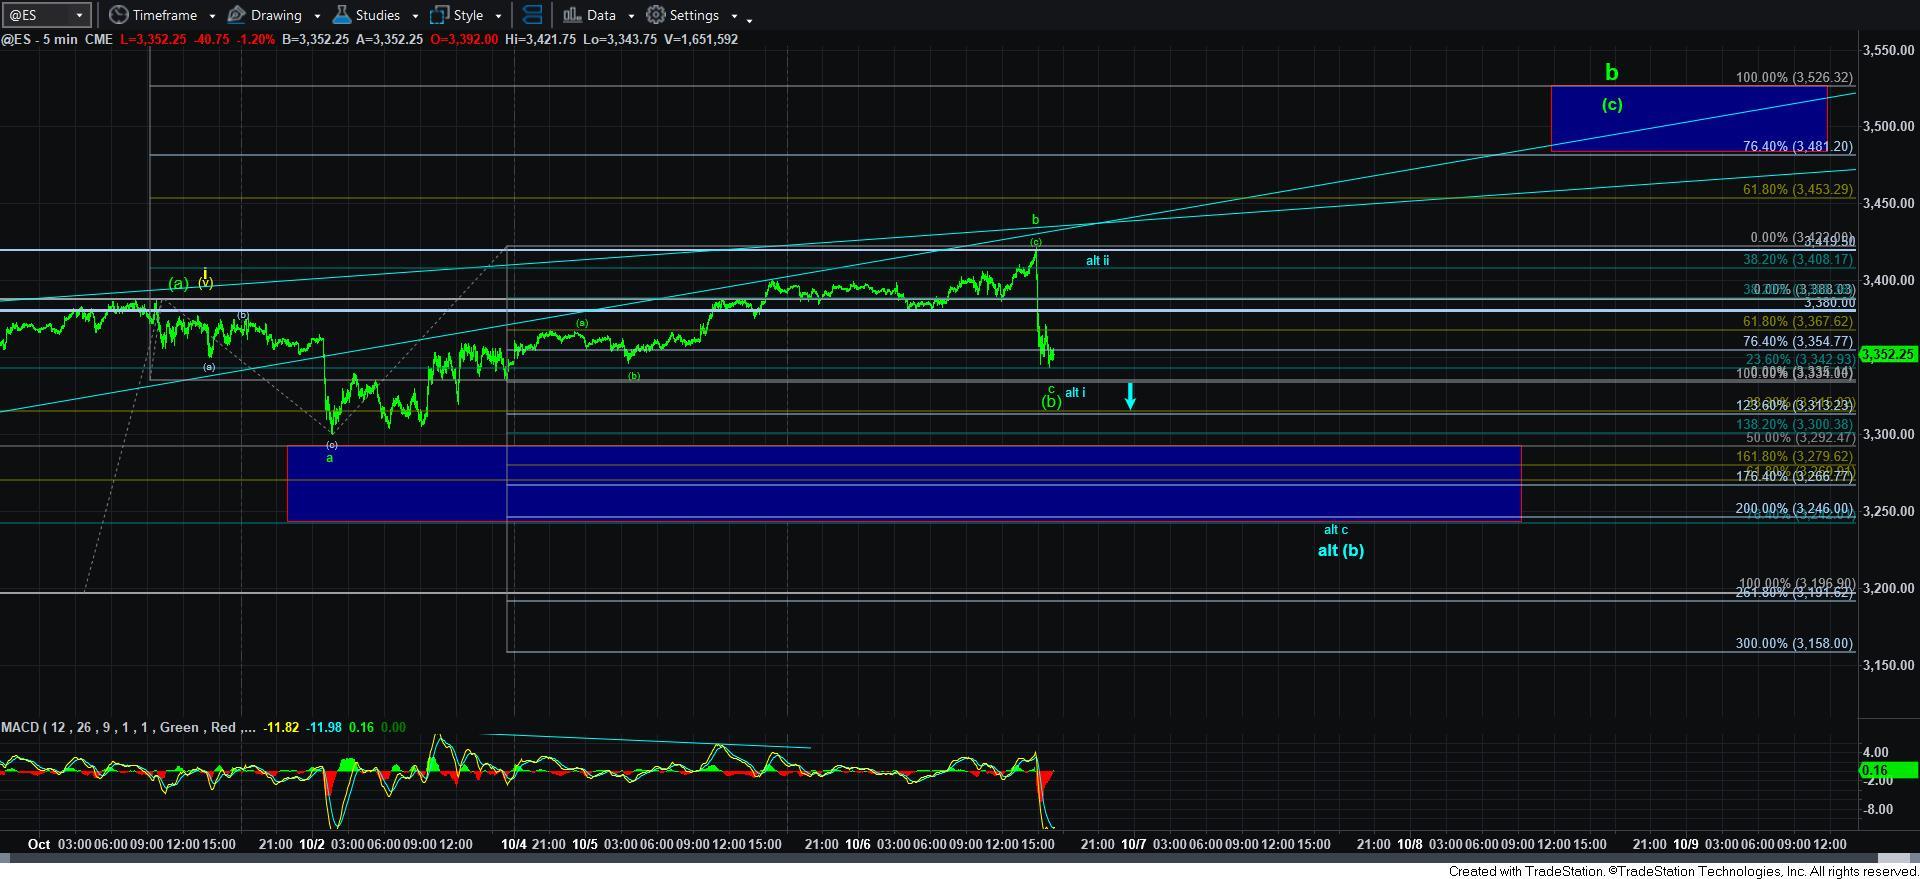
One of the potential patterns I have been tracking is the expanded [b] wave structure, which has a b-wave which is higher than the initial high of the [a] wave structure. Some of them can make lower lows relative to where the higher b-wave began (presented in blue), and some can be considered running [b] wave structures (presented in green).
And, with the ES dropping down in 5-waves from today’s high, it leaves the door open for BOTH interpretations.
But, there are even further, and more immediate bearish ways to view the market at this time, so I am going to take my time and try to explain the parameters as I see them right now. But, as I said after we completed the [a] wave decline, the easy part is clearly over.
For now, PLEASE view the market as being in a treacherous posture for both the bulls and the bears, and do not assume that the market MUST do one thing or the other. This is the time to allow the market to provide more clues as to its LIKELY next bigger move before becoming aggressive in one direction or the other. And, if you do not respect the market potential on both sides of the tape right now, I am certain you will be whipsawed.
First, I have outlined the running [b] wave structure on the attached ES chart, and it is presented in green. And, as long as we hold the 3334ES region (which is the a=c in this running [b] wave structure), then we can view this as a reasonable potential for the market to point us higher in the coming week. But, I MUST see an impulsive 5-wave rally develop off this drop to be convinced that we will indeed head higher in the coming week towards the 3480-3525ES region.
Alternatively, this may only be the wave i of the bigger c-wave of the alt [b] in blue, which would be pointing towards the 3220-40ES region. But, the issue with this potential is that it would call for a VERY deep wave ii rally back up towards today’s high before we begin the decline in a bigger c-wave for the alt [b] in blue. You see, in order for us to really hold the support we would normally want to see for the [b] wave in blue, the waves i and ii to the downside in the c-wave of alt [b] in blue must project to hold the lower end of support for this potential count. Otherwise, if all we see is a shallow wave ii retrace then it would lead me to the much more immediately bearish conclusion that we can possibly glean from the IWM structure, and that is why this has become so treacherous right now.
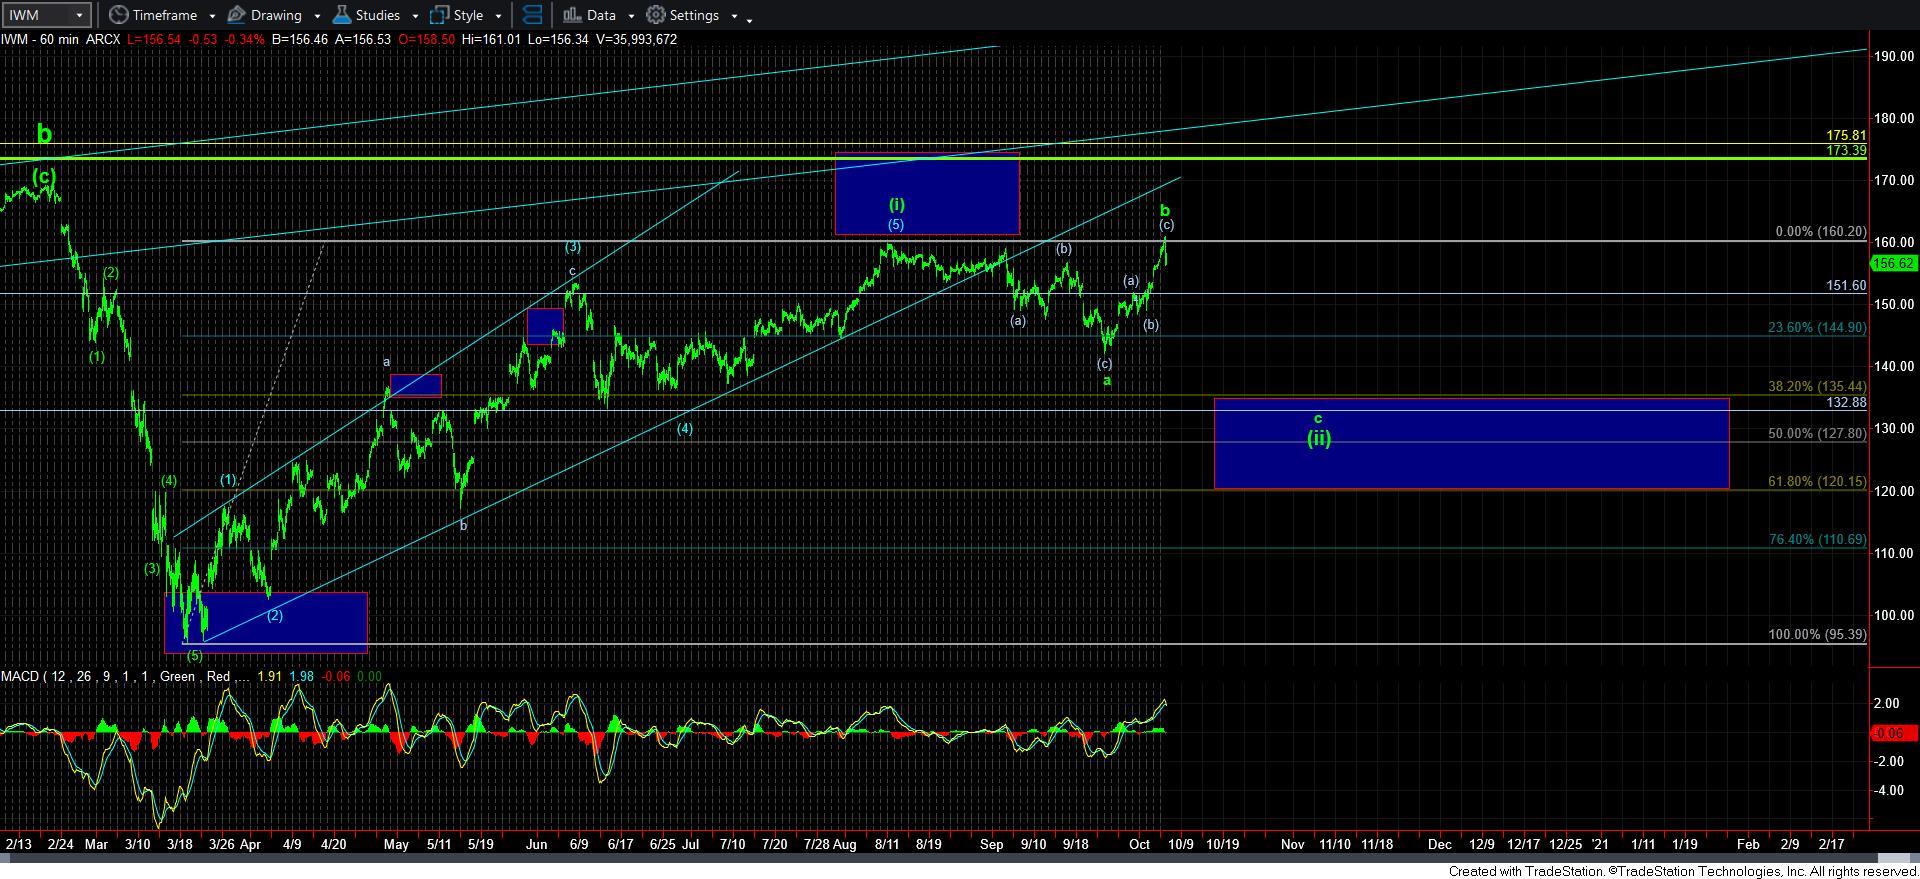
So, let’s discuss the IWM for a moment. As you can see from the attached IWM chart, we have reached the minimum expectation I would have for a b-wave in this wave [ii]. As I noted today in the chat, when wave [i] does not attain the ideal targets we normally would see, the b-wave within the ensuing correction will often come back and strike those higher highs before turning down in the c-wave of the correction.
So, at this time, with the IWM hitting a higher high, and potentially completing a minimum [a][b][c] rally before turning down in what is arguably an initial 5-wave decline, there is strong evidence that we may actually have begun the bigger c-wave decline in wave [ii]. While I can make an argument that we can still get a higher high and this pullback is really a 4th wave in the [c] wave within the IWM, I cannot say that I would be trading for that potential in an aggressive fashion. This is the chart that gets me concerned that we could begin the c-wave decline in wave [ii] sooner than I had initially expected.
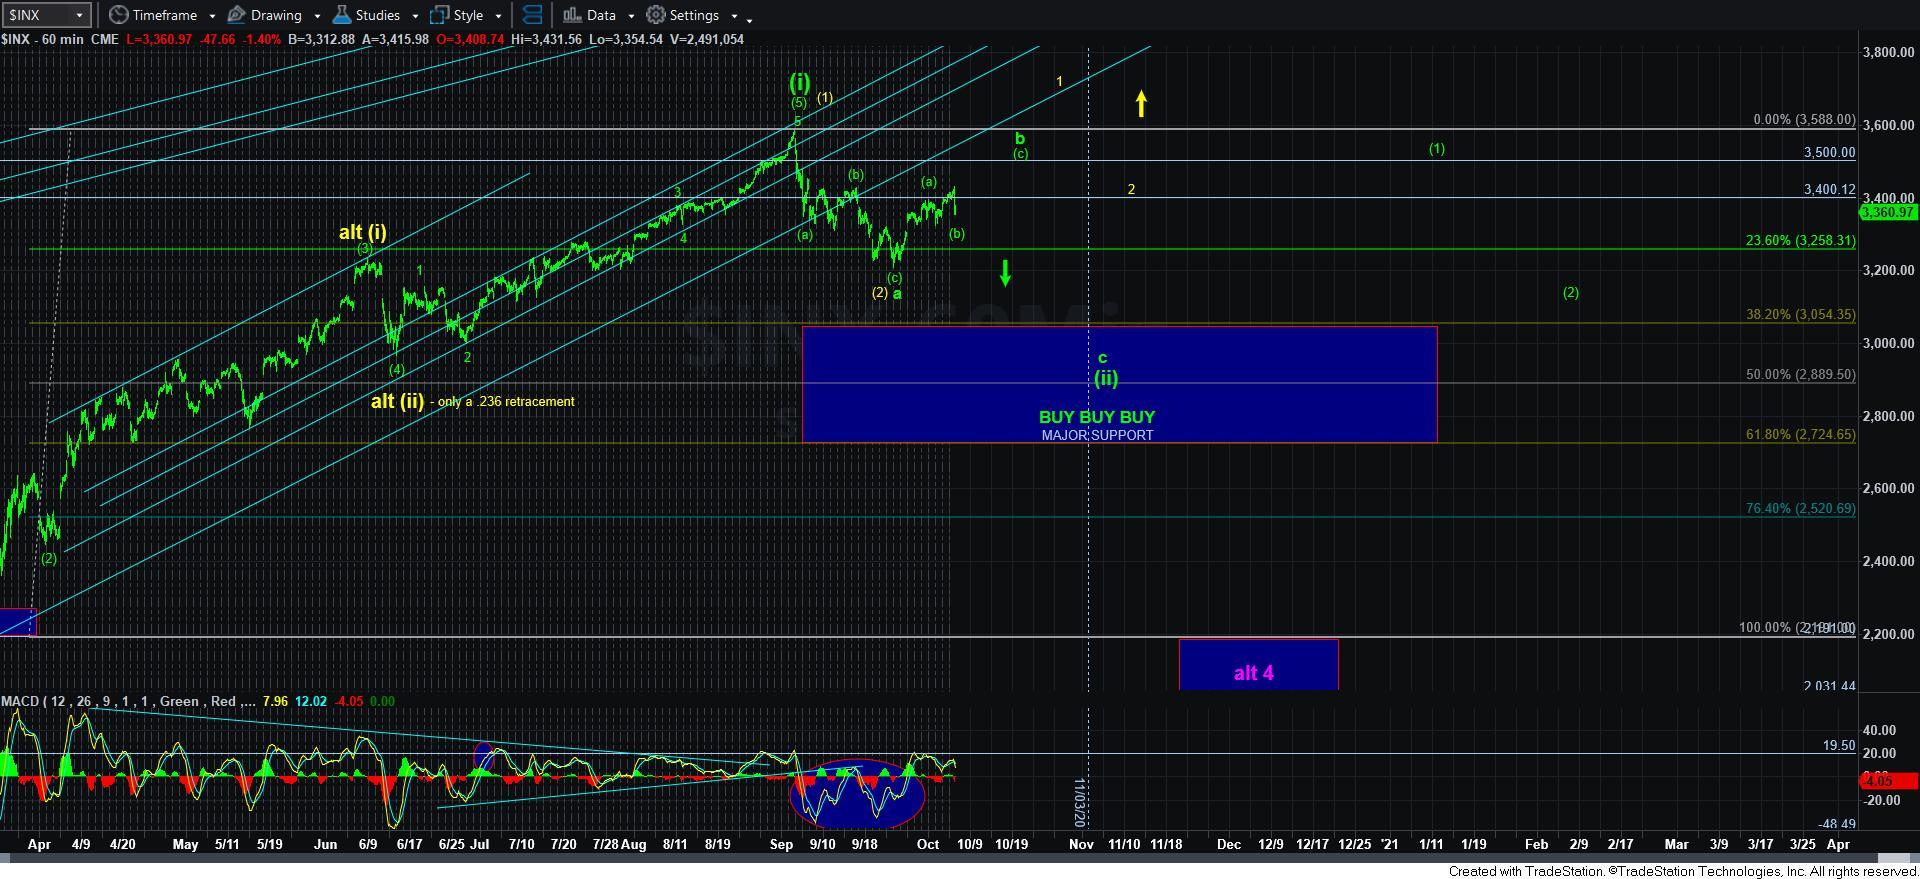
So, for now, I would suggest that the 3334ES level is important micro support. If the market is going to attempt an immediate rally as presented in green, then we must hold that support and begin an immediate 5-wave impulsive rally to begin the [c] wave of b. Otherwise, if we break below 3334ES or if we only rally correctively, then I am going to assume we will test the 3250SPX region in the coming days, and potentially even signal the start of the bigger c-wave in wave [ii] a lot sooner than I had initially expected.
Again, please recognize that these parameters are not arguing strongly for a bullish perspective in the near term. I still do not have anything that provides me with a strong indication that the market is going to resolve bullishly in the coming weeks. Rather, much of the evidence is still pointing to the green count from the larger perspective, as the rally thus far as not provided us with a strong indication that the yellow count will follow through in a meaningful way right now. So, I would caution you from being too aggressively bullish in the coming weeks until the market can prove otherwise.