Pre-Market Update On SPX
I have been racking my brain trying to come up with a more reasonable way of viewing the SPX action. And, also considering that the IWM and NDX may be bottoming soon as well, it does add another factor into my consideration.
Normally, I resolve wave count questions through KISS and Occam's Razor guidelines. That is, until the market forces me to view other more complex options. And, at this point in time, I seem to be at that point.
So, I have been working on this 60-minute SPX chart all morning, and I have come up with a relatively elegant but yet very complex answer to the structure with which we have been dealing over the last 4 months. And, it is based upon a [w][x][y] structure for the wave iv.
In fact, this is so complex, that both the [x] wave and the [y] wave present us with expanded b-wave structures. And, I do not ever recall seeing this type of structure before. Yet, it seems to be the most reasonable count I can come up with.
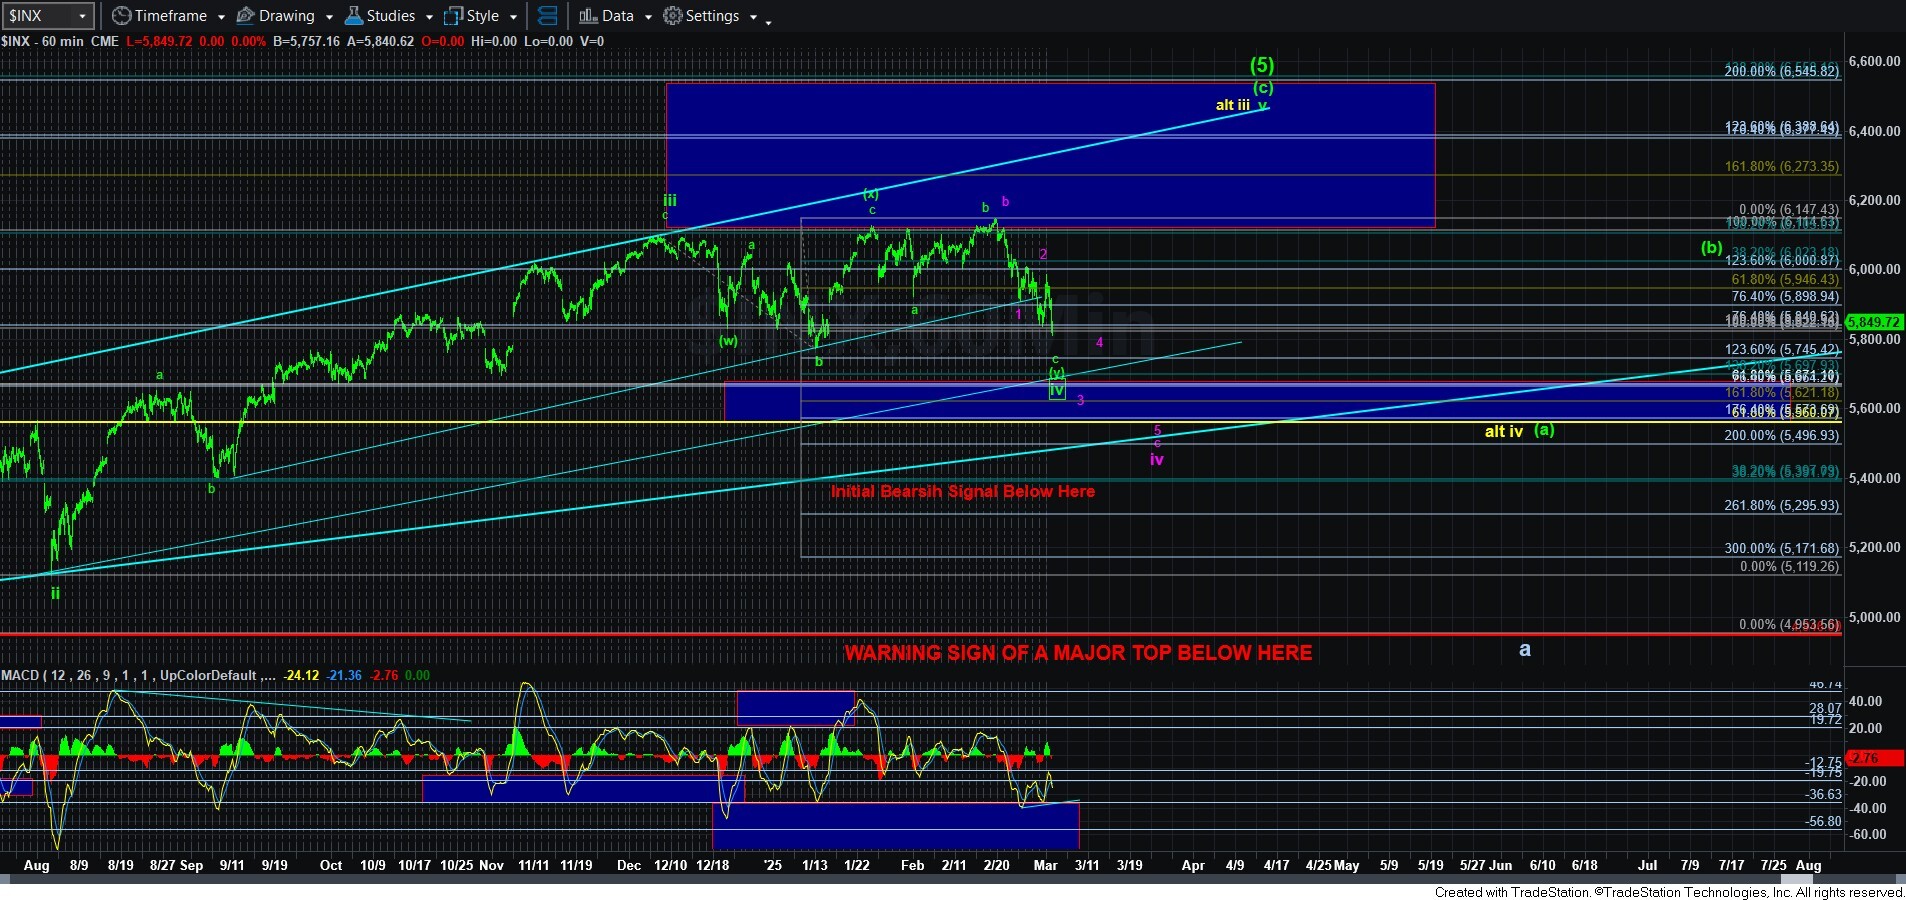
As far as parameters, we are now just below the region wherein [w]=[y]. Just below us is the region where [y]=1.236*[w], in the 5745SPX region. So, I will be viewing the low of the [w] wave at the 5773SPX level down to the 5745SPX region as the support right now. Clearly, below that, I have to view the purple count as our primary. But, the fact that we are seeing a MACD positive divergence along with us hitting the MACD support, and potential completion of NDX and IWM in their declines all at the same time make me much more strongly consider this [w][x][y] in SPX at this time.
Should we rally over 5986SPX, that would likely signal that this wave iv has completed and wave v is in progress.
Yes, this has been VERY complex, and very frustrating. In fact, more frustrating than most of the 4th waves I have dealt with in the past, as I do not ever recall seeing multiple expanded b-wave structures within a correction like this. Yet, it seems to make the most sense when considering all the factors.