Possible 5-up In Futures
I wanted to write this update early, since it is my outlined for how I am looking for a potential break out sooner rather than later. So, please review this carefully, as it discusses two main wave degrees – the 1-3 of [3], and the POTENTIAL i-ii of 3 (the smaller degree).
While I was doing my usual morning calculations on the overnight structure, I found a potential 5-wave leading diagonal, which does adhere to standard leading diagonal structures.
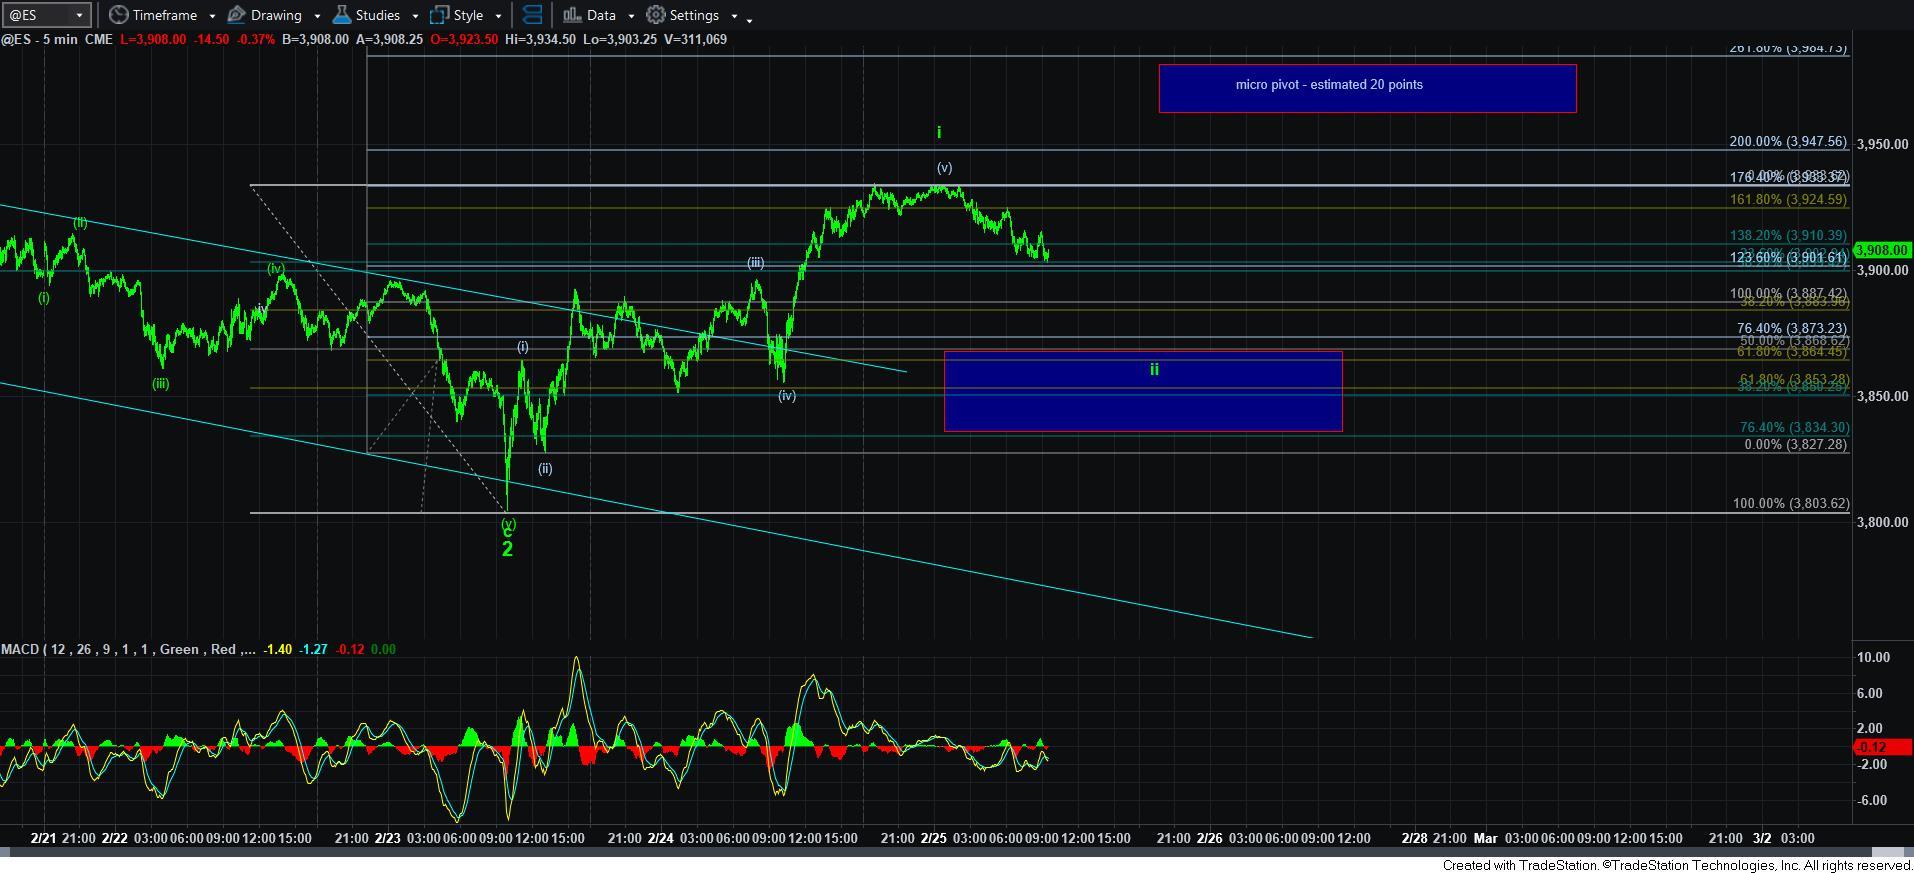
In a standard leading diagonal, wave [iii] targets the 1.236 extension, wave [v] targets the 1.764 extension, and we have overlap in waves [i] and [iv]. As you can see from the attached 5-minute ES chart, our rally off this week’s low fits that bill. So, I have to begin tracking this as wave i of 3.
I have added support for wave ii of 3 between 3834-3870ES on the 5-minute ES chart.
Now, in the event that support holds, and we begin a strong rally, the main point of reference I will be focusing upon is the .618-.764 extension of waves i and ii, which will be our micro pivot. Right now, I do not have it exactly labeled because I still have no clear evidence that a wave ii has been struck. I will have to wait until we get an initial rally over the high of wave i.
That micro pivot will be my trading point of reference. Once we exceed that pivot, then the support will becoming the bottom of that pivot, which I am estimating will be approximately 20 points. Should we break out over that micro pivot, then the probabilities become high that we are in wave iii of 3, and targeting the 4300SPX region for wave 3. Therefore, if you choose to go long over the micro pivot, you will have an estimated 20 points of risk for a potential 300 point rally.
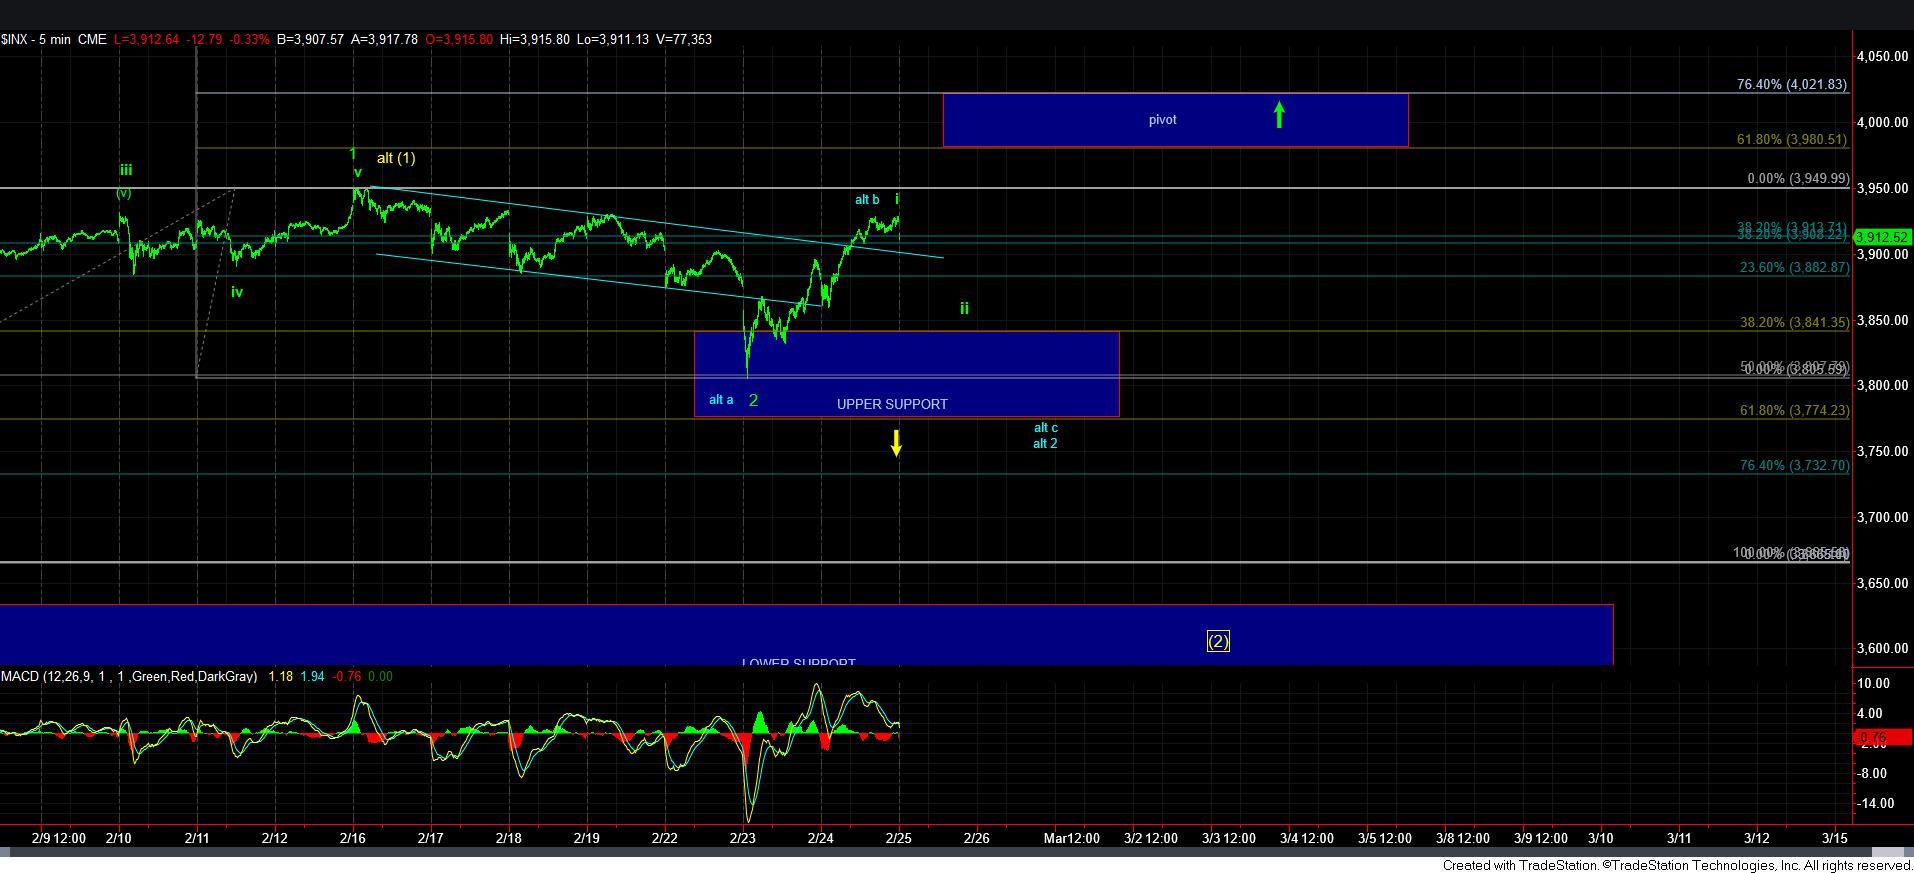
This now brings us to our 2nd pivot, presented on the 5-minute SPX chart. This pivot is based upon the .618-.764 extension of waves 1 and 2, assuming they are now in place. So, we will be doing this exercise again, but on one higher wave degree – the 1-2. Once we exceed the .764 extension at the top of that pivot, you can set your stops at the bottom of the pivot just below the .618 extension, which now locks in any profit you have at a minimum. If we are indeed heading to the 4300SPX region for wave 3 of [3], I would not expect us to be breaking back below either of these pivots on our way up, but it is how I use these pivots for risk management purposes.
Lastly, if this overlapping rally is really a b-wave within wave 2, as presented in blue on the 5-minute SPX chart, the a=c points us exactly to the .618 retracement of wave 1, which is in the 3775SPX region. Should we break down below 3834ES, then it makes it more likely that wave 2 is not yet complete. And, as noted many times, a sustained break of 3775SPX makes it more likely that wave [2] in yellow is not complete.
So, this is how we use Fibonacci Pinball to provide us with parameters for our patterns, as well as assist us with risk management. I wanted to send this out early this morning, since much of the next week will be based upon this plan.