Please Recognize The Risk Here
 By
By
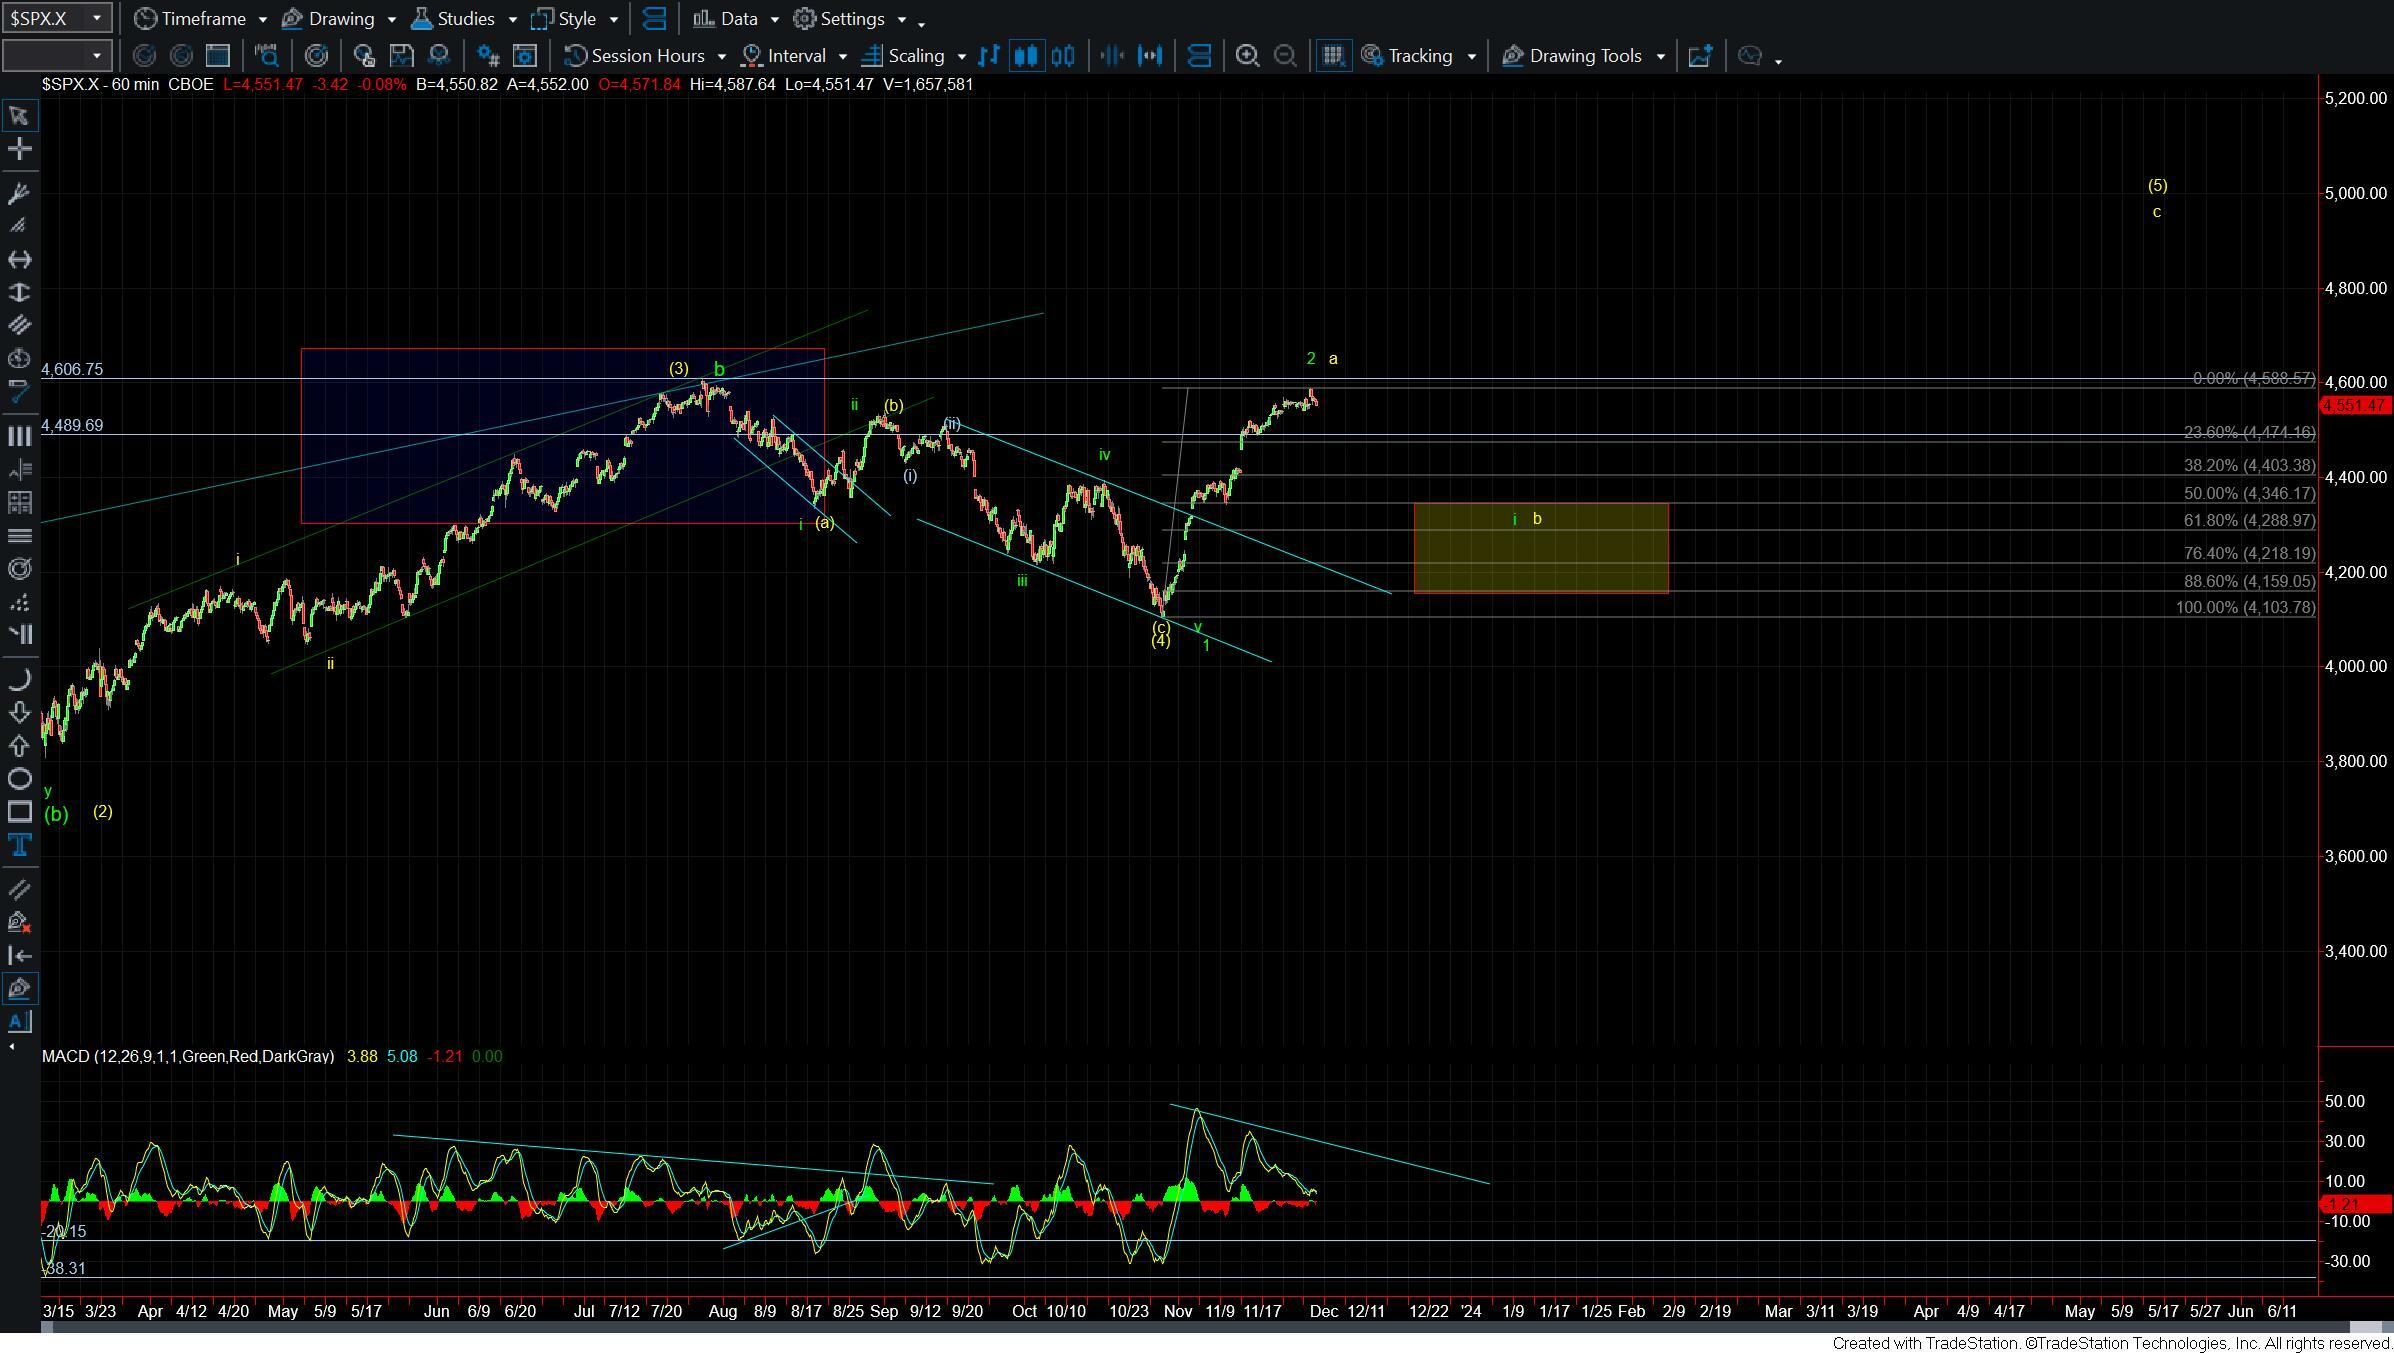
Today the market opened higher but has since turned lower and is now trading red on the day. While this push higher is certainly putting pressure on the green count and we are getting very close to invalidating that path as long as we remain under the highs that were struck in July we still have to remain cautious here and recognize the risk of the market seeing a significant top in this region as we have laid out per the green count.
In both of the counts that we are watching (green and yellow), the market is quite stretched as we have discussed over the past couple of weeks. So with that seeing a local top in this region remains likey. The bigger question at hand is that once we do see that top is that top going to be the top of the larger wave 2 per the green count or simply a wave a per the yellow count.
Bigger picture as long as we remain under the 4607 level on the SPX we still can count this as a very deep wave 2 retrace. Under that case, we would still need to see a full five-wave move to the downside to signal that we have indeed put in a top in that wave 2. If we are able to breakout over that 4607 level then it would invalidate the green count which should then firmly put us in the yellow count. Again I still would be looking for a pullback for the wave b under the yellow count but that pullback should remain corrective before heading higher in the wave c of (5) under that count.
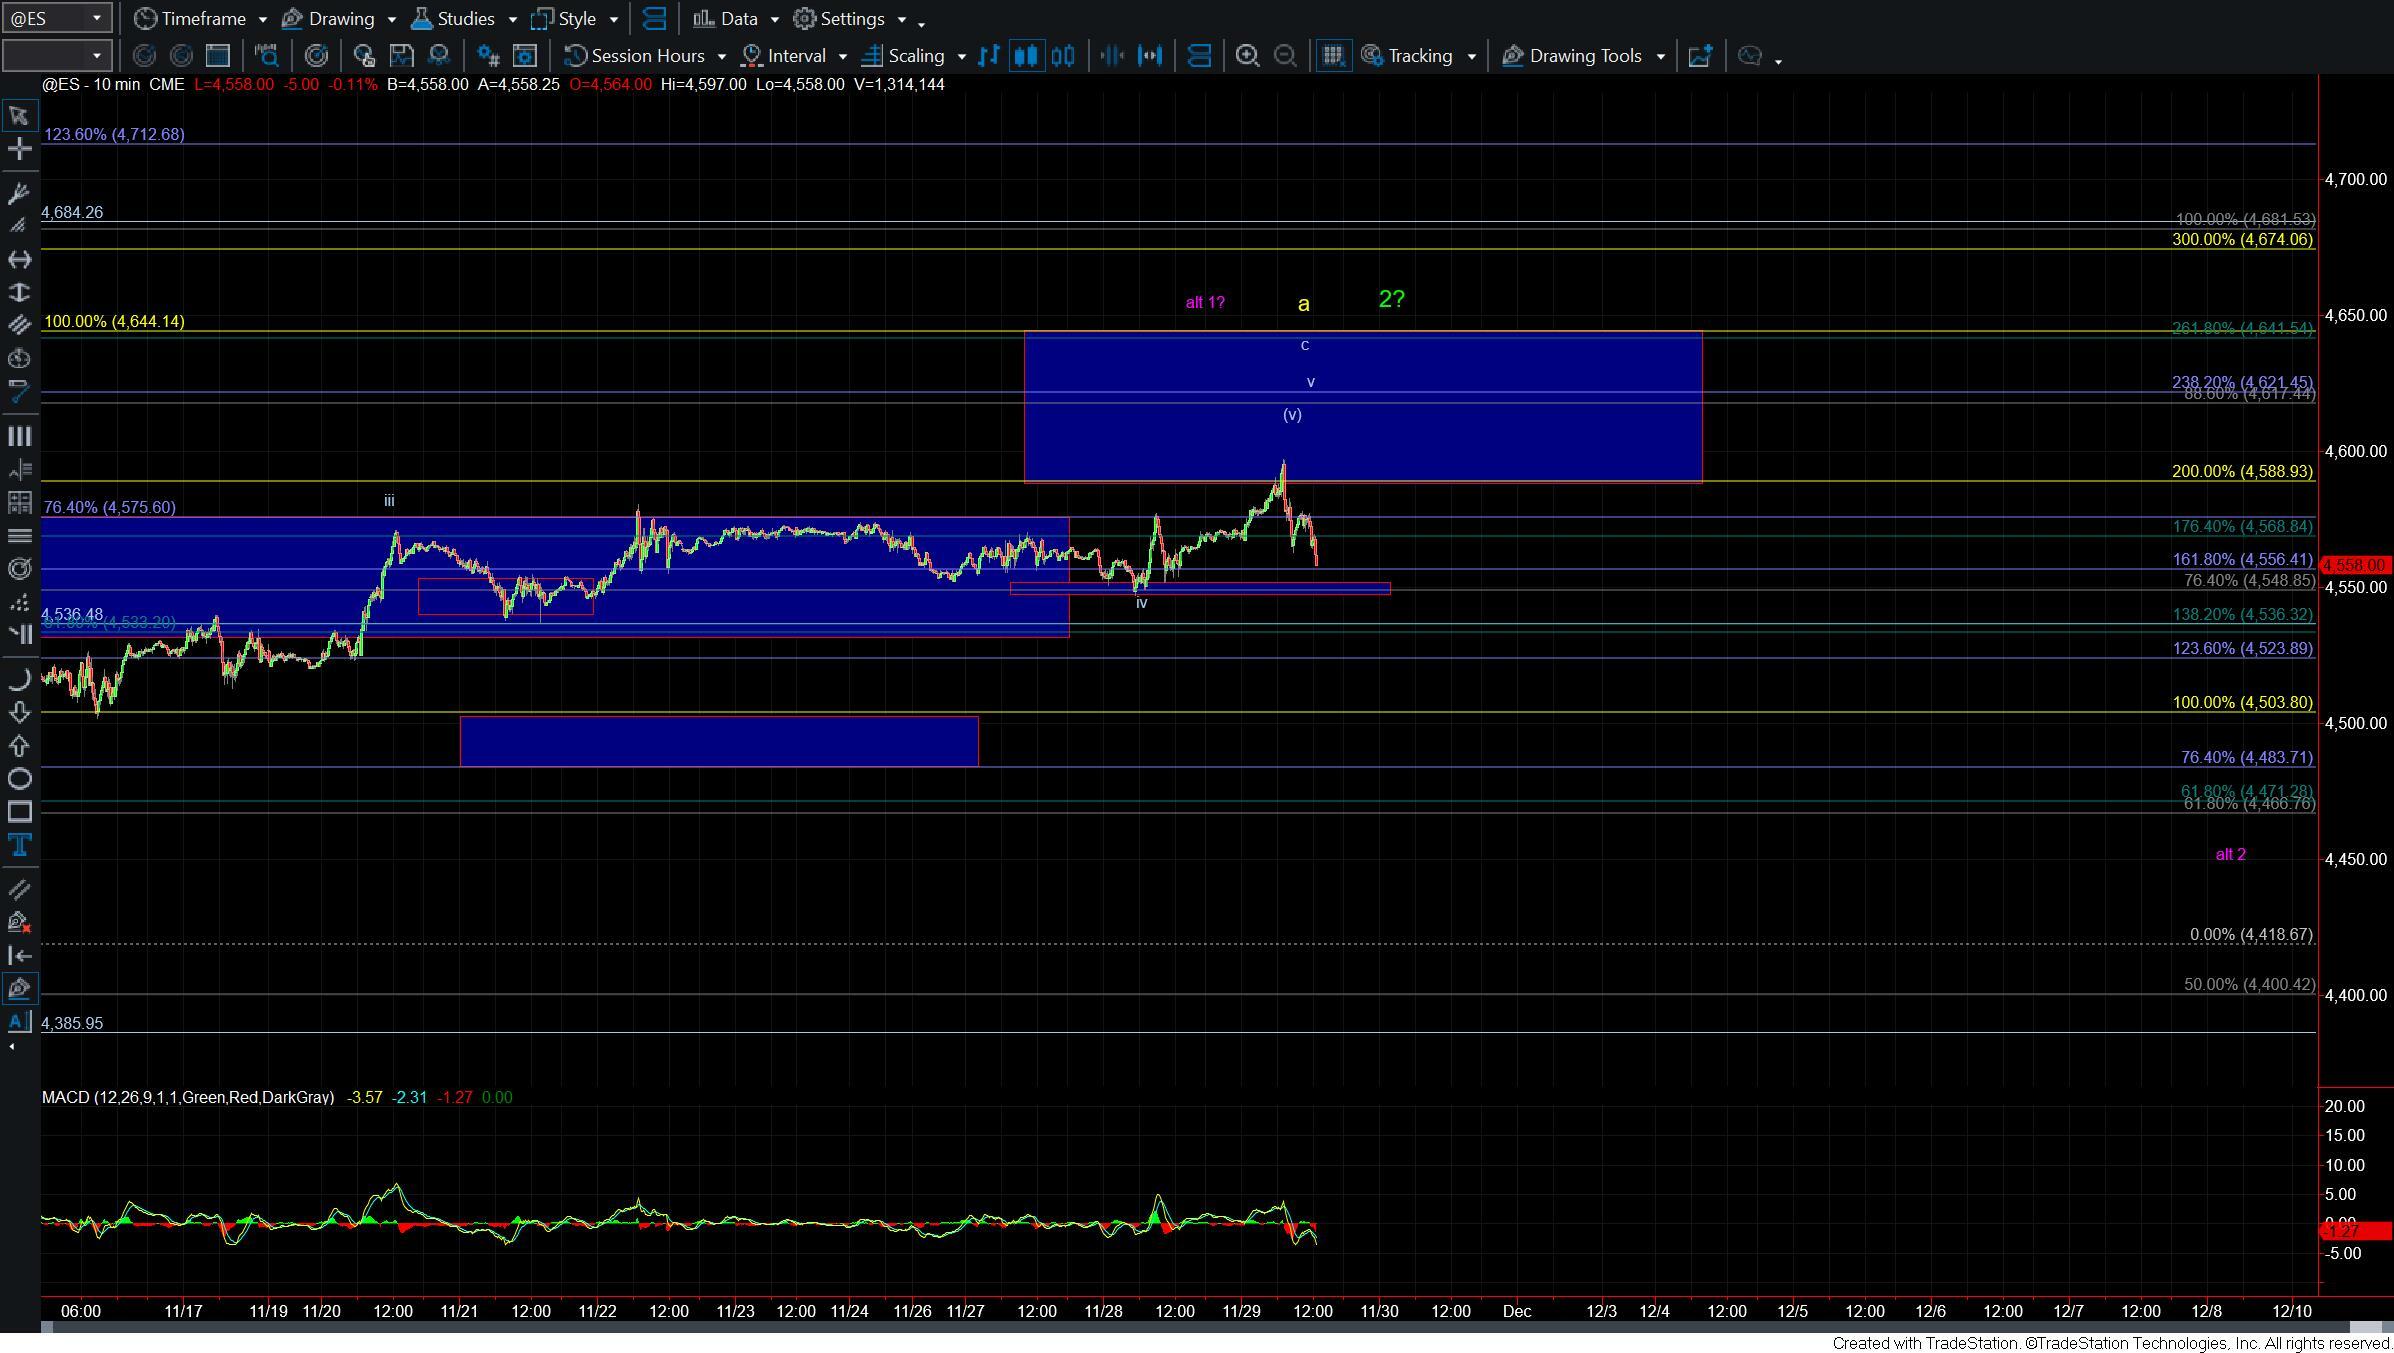
Drilling down to the smaller timeframes and as shown by the ES chart we still need to break under the 4548 level at a minimum to signal that we have indeed put in at least a local top. If and when we can break that level then further confirmation of a top comes with a break under the 4503-4483 level. Once those levels are taken out then the structure of the next leg down will become very key as again a five wave move to the downside would open the door for this to follow the green count and move to new lows under the October low. Moving down in a corrective fashion, however, would keep the yellow count very much in play at which point 4346-4218 will become the key support levels below to hold before turning higher in the yellow wave c of (5).
So again while this move up off of the lows is most certainly strong and opening the door for a push to new all time highs until we can actually see a breakout over the 4607 level we still must remain dilligant and recognize the risk of this seeing a more significant top in this region. Of course we do need to see a full five wave move to the downside to give us confirmation that the green wave 3 down has begun. For now however, the pattern and price levels as noted above should help give us guidance as we continue to navigate this market in the days and week ahead.