Personal Preference vs. Price Action
We all struggle with the financial markets, as they seem to surprise so many and make sense to very few. So, rather than maintain “beliefs” about what we think we know, I have always fallen back upon price action to provide for me the truth in the market.
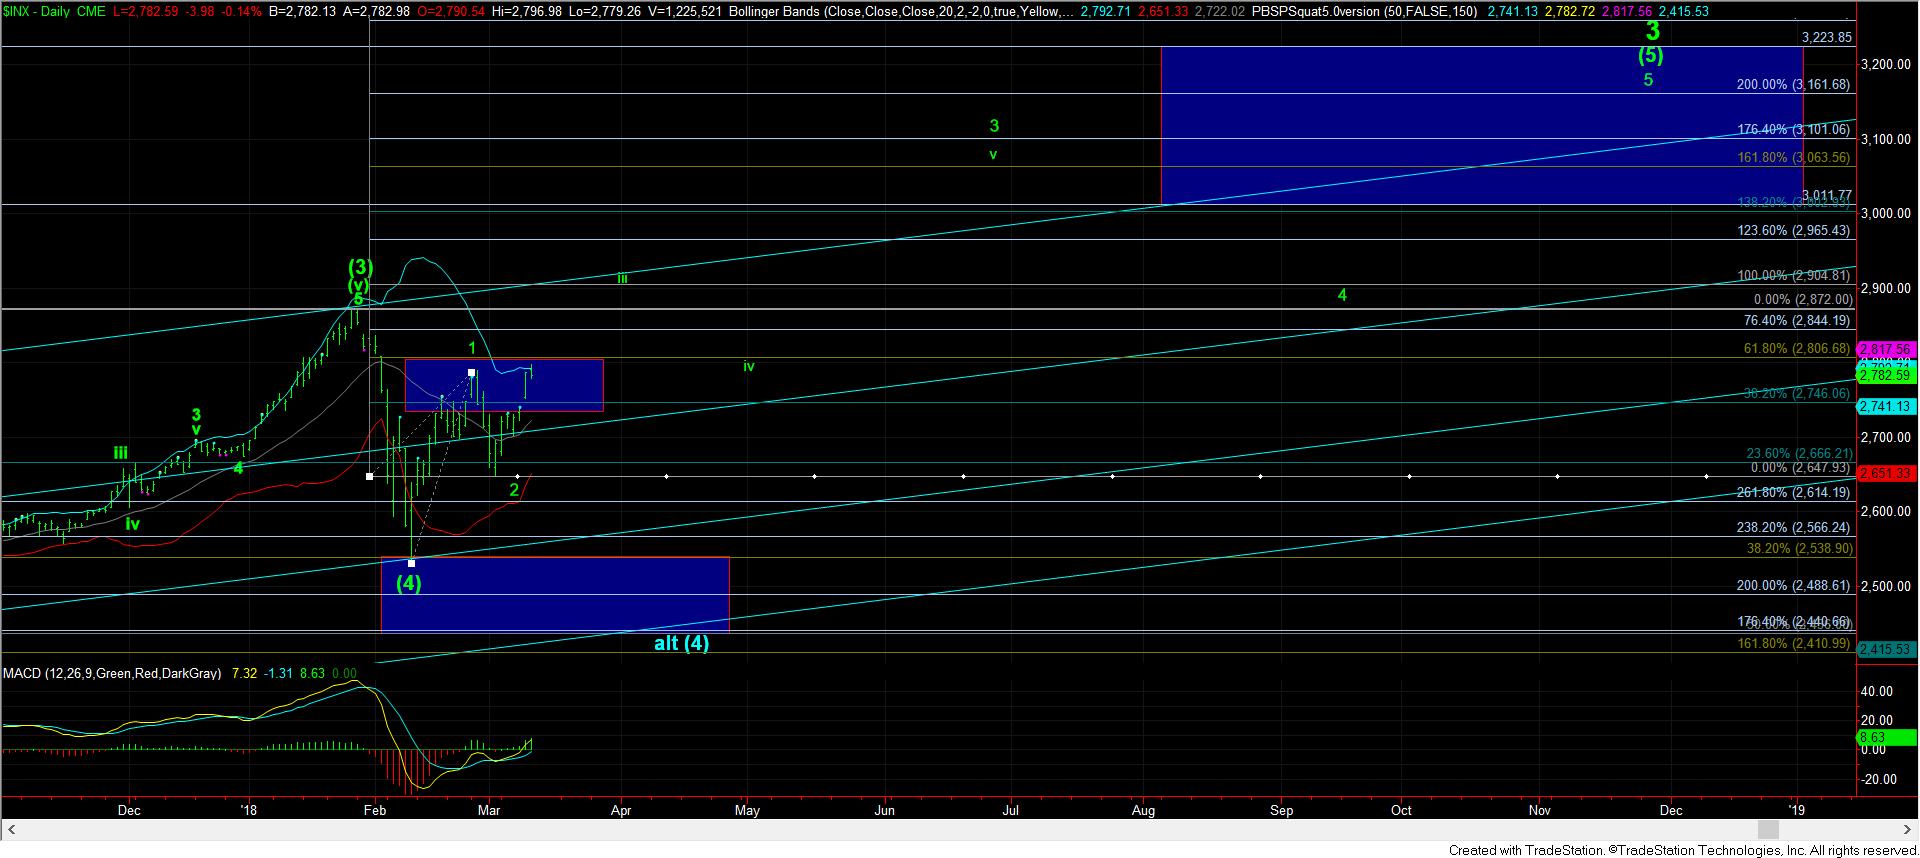
When we began this pullback a little over a month ago, we set a target for this wave (4) between 2424-2539SPX. And, in February, we struck a low around 2533SPX. But, even though we struck our target for wave (4), we did so in less than 2 weeks.
Until Friday, my expectation was that we would see a more protracted wave (4) pullback, and revisit the 2530SPX region, with the potential to drop all the way down to the 2440SPX region. My perspective viewed the low we struck around 2530SPX as only the a-wave of wave (4). The main reason was that it was hard for me to rely on a less than two-week correction to provide us all of the wave (4), when wave (3) took a year and a half.
Yet, even though I expected a more protracted 4th wave, I also expected that we would see a rally in a b-wave, with a minimal target of 2727SPX. So, I went bullish on the market after the SPX came down to the double bottom we struck in the futures in the 2530SPX region. And, once we struck our 2727SPX target region from the 2530SPX region, I was going to be patient to see how the market reacted, and how it would potentially set us up for another drop in the c-wave of wave (4).
However, as the market continued higher, it completed what can be counted as a full 5 waves up off the 2533SPX low into the 2789SPX region. That caused me to consider the alternative that wave (4) may have bottomed. But, it was still quite hard for me to buy into that premise due to the timing issue I noted before. I still struggle with accepting a 10 day 4th wave supposedly correcting a year and a half long 3rd wave.
When the market dropped down from the 2789SPX region to the next support region on our charts in the 2650SPX region, I again looked for a “corrective rally” to present us with a set up for a sizeable drop in the c-wave of wave (4). However, as the market developed at the end of last week, it took us much higher than this corrective rally should have taken us. And, today, we broke through the 2787SPX level, and followed through over the 2789SPX, which invalidated the immediate bearish set up.
Now, when the market has a bearish set up in place, and refuses to take advantage of it, that is a strong signal to me. Moreover, when the market has a potential bullish pattern in place during a bull market, and invalidates a bearish potential pattern in order to continue in the bullish pattern, well, it is at that point I have to pay attention to what price is saying. For this reason, as I telegraphed I would do last week, I have moved to the more immediate bullish pattern.
Of course, I would have preferred a cleaner 5 wave structure for wave (i) for this bullish structure. You see, the wave (i) on the 5-minute chart began with a leading diagonal, and ended with a truncated 5th wave top. Again, as I have mentioned so many times before, this is NOT a clear bullish signal to me, but certainly looked much more corrective than bullish. But, when price broke out today over the 2789SPX region, I have no choice but to respect that potential bullish pattern.
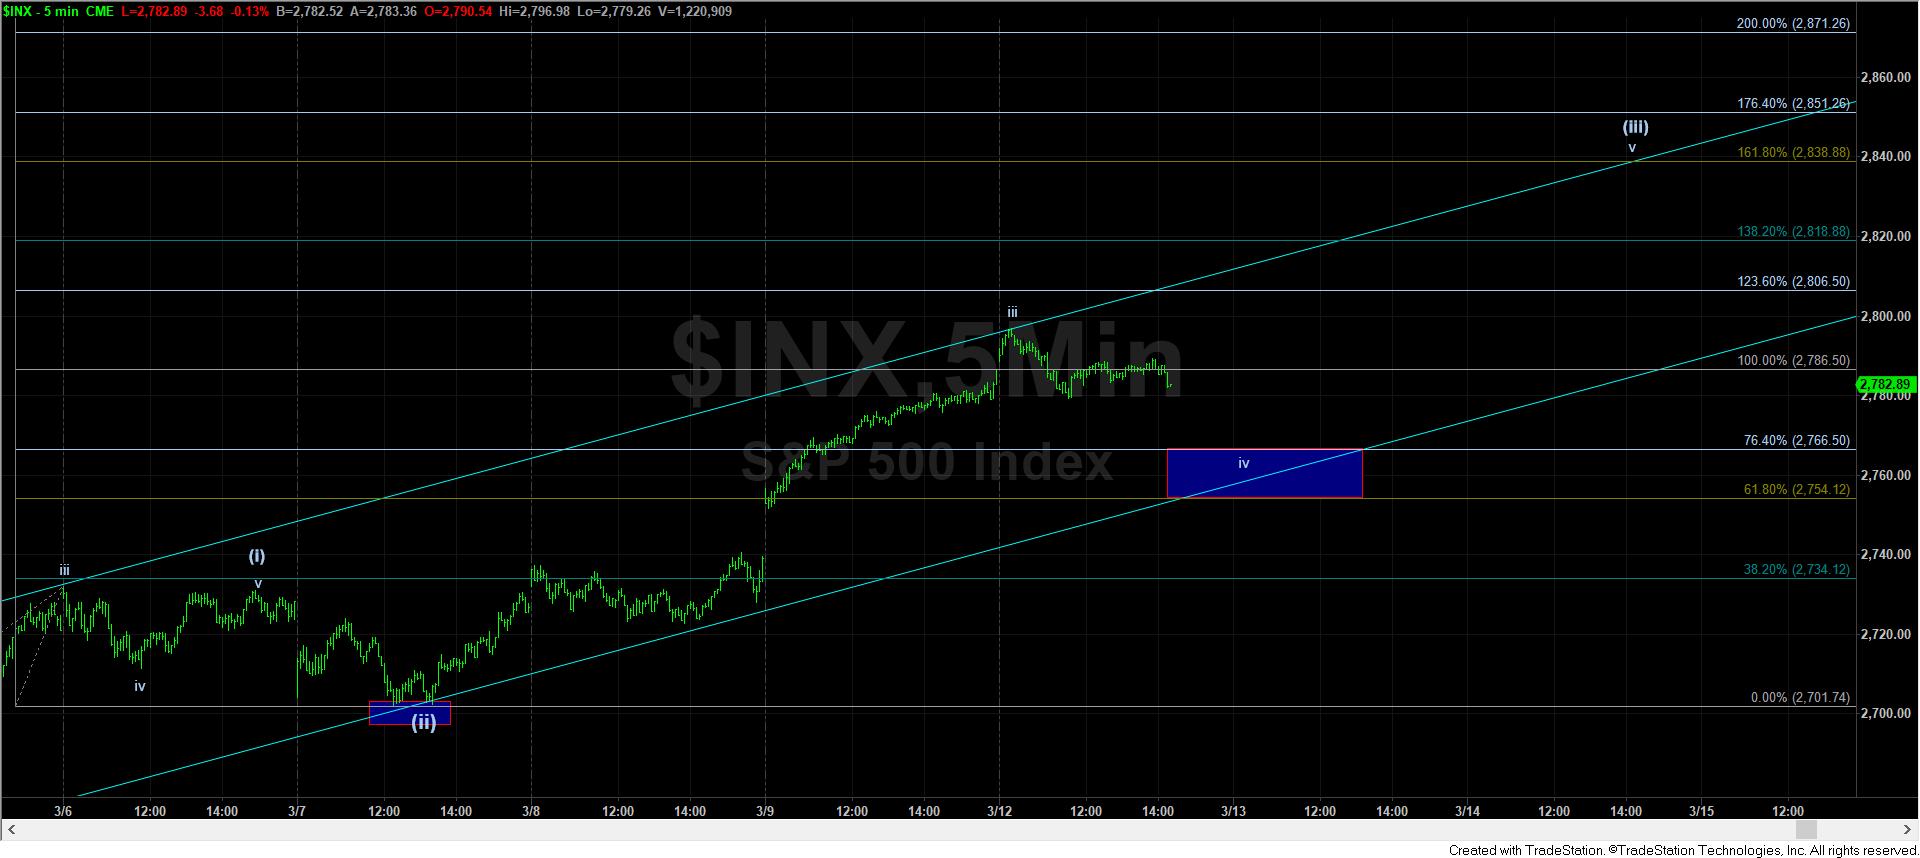
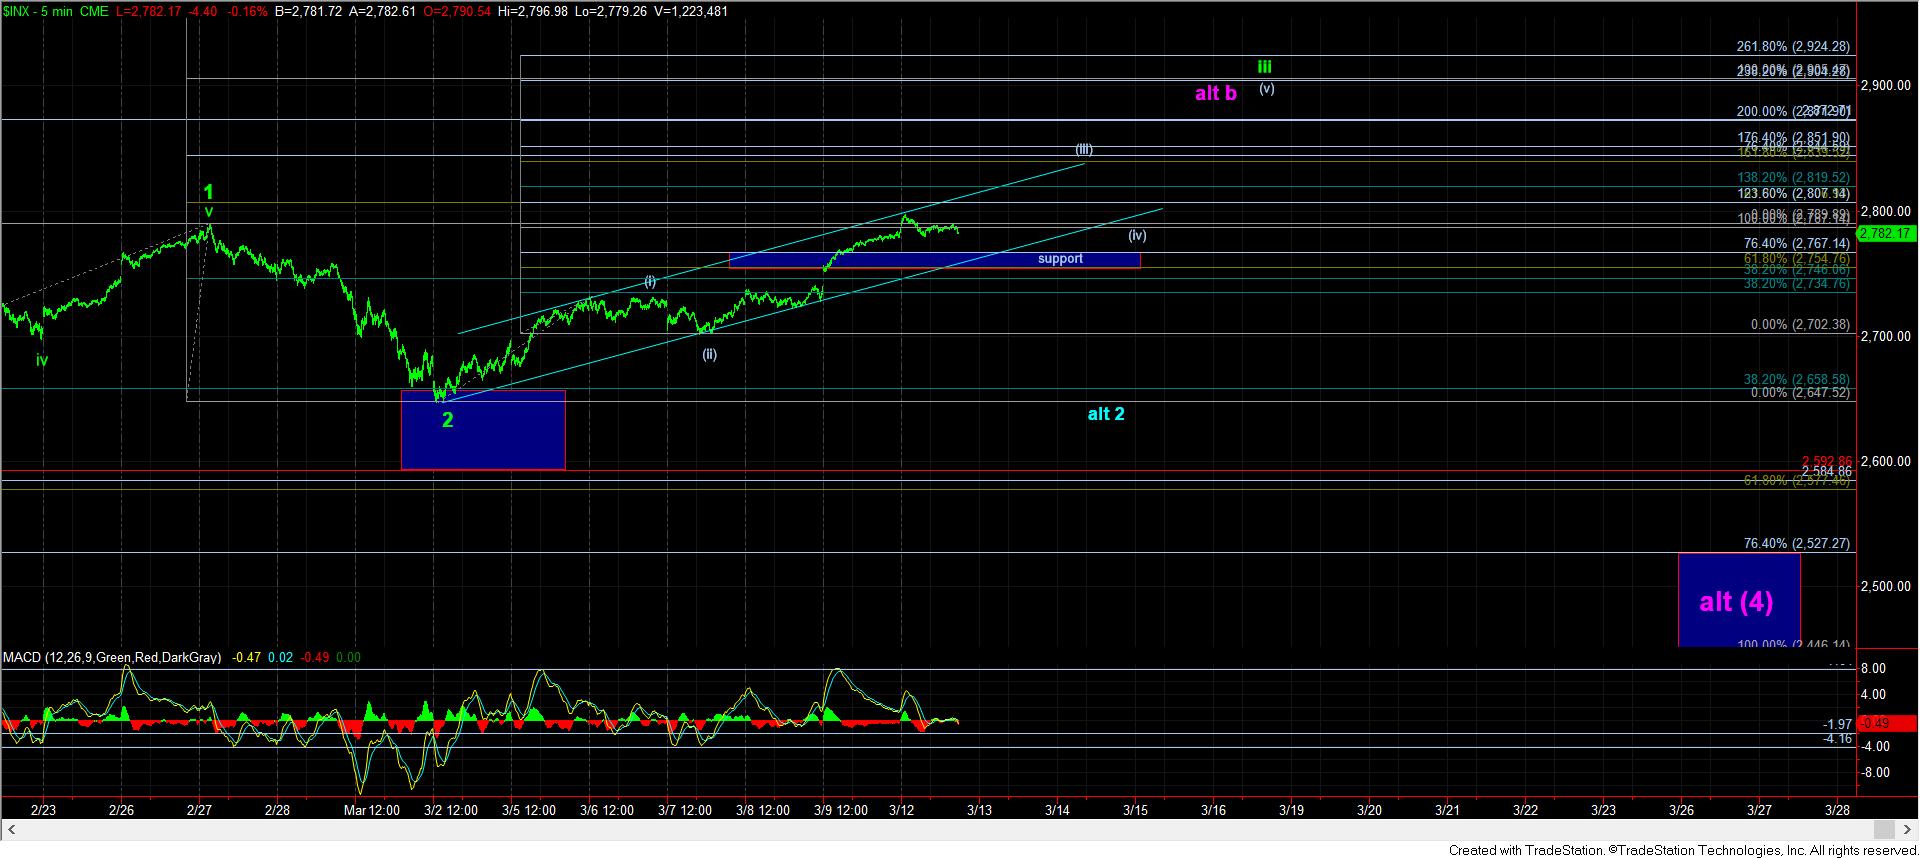
So, in summary, since moving to the sidelines once we struck the initial target I had off the lows in the 2727SPX region, I have again turned bullish, and am looking higher in the market. Of course, this may be my “Gartman-moment,” where the market will turn down on me, and whipsaw me once I change my expectations. For that reason, I have noted the support region which the bulls must now hold at all times in order to keep me on the bullish side of the market. That support resides between 2754-2767SPX, which is the .618-.764 extension region in this Fibonacci Pinball pattern looking higher. It takes a sustained break of that support to have me reconsider the more protracted wave (4) potential.
Moreover, as we move higher, I will continually move our support up through our Fibonacci Pinball levels, so that if support does break, we will have an early warning that the bulls may not follow through in direct fashion to our next higher target region in the market between 3011-3223SPX. But, for now, I have to give them the benefit of the doubt.
For now, we have support between 2754-2766SPX. And, as long as that support holds over the next day or two, we are pointing up to our next minor target in the 2839SPX region for wave v of (iii).
In tomorrow’s update, I will try to line up the further buying opportunities (other than this wave iv on the 5 minute chart) at our next support levels should we continue to move higher.