Pattern Still Bullish As We Look Towards A Minor Pullback
 By
By
Today both the ES and SPX pushed higher after consolidating yesterday which has presented us with a clean five-wave move up off of the lows on both charts. Having this five-wave structure is very much supportive of seeing further upside action in the coming weeks ahead.
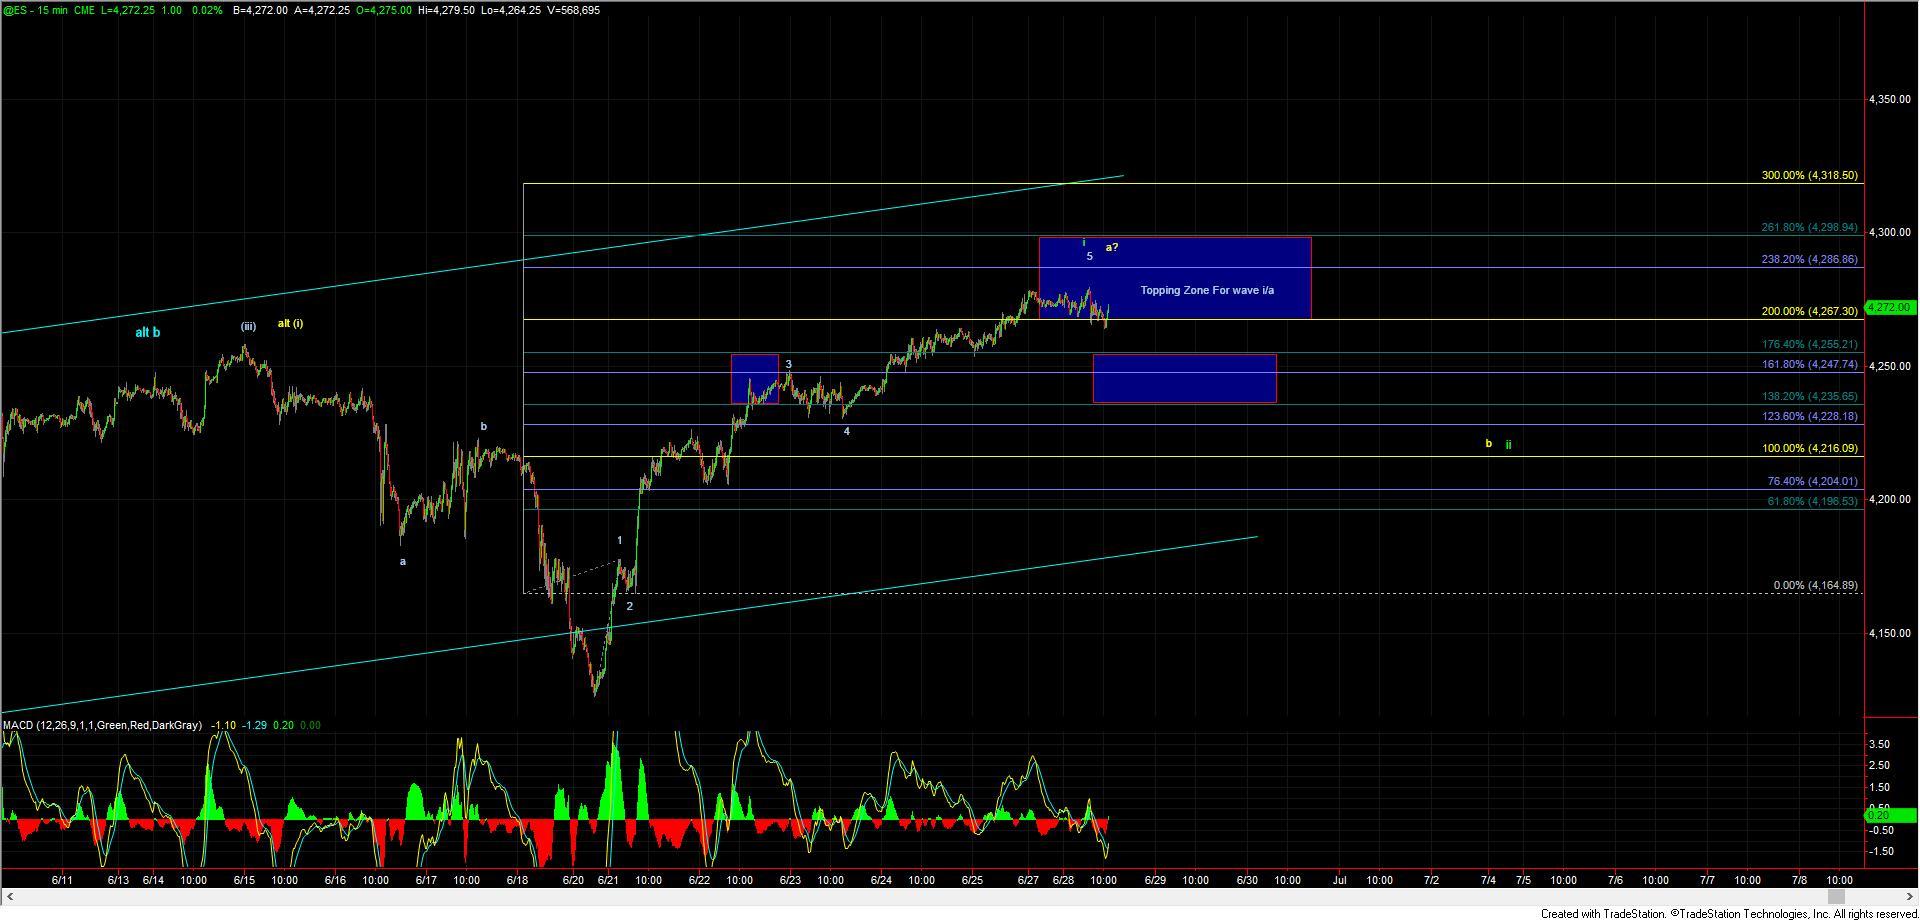
From a structural perspective, there has been very little change to the count on the ES since last Thursday when we pushed higher and completed a potential five up off of the lows. This push higher has put us on the lookout for the next pullback which as noted last week and in Avi's weekend update for another buying opportunity in the equity markets.
As noted last week the primary green count is suggestive that we are finishing off a wave i from the lows that were struck on June 20th. The move up into the current levels gives us enough waves to consider that five-wave move completed. From here I am looking for a break under the 4255-4235 zone as shown on the ES chart to give us an initial signal that we have indeed topped in that wave i.
Although we did see a full five up off of the lows I still cannot fully eliminate the yellow count just yet. This is due to the fact that this five-wave move off of the lows can still count as wave a of (v) under the yellow counts ending diagonal. The yellow path would however project beyond our major market pivot level which does shift the odds to the more immediately bullish count now labeled in green.
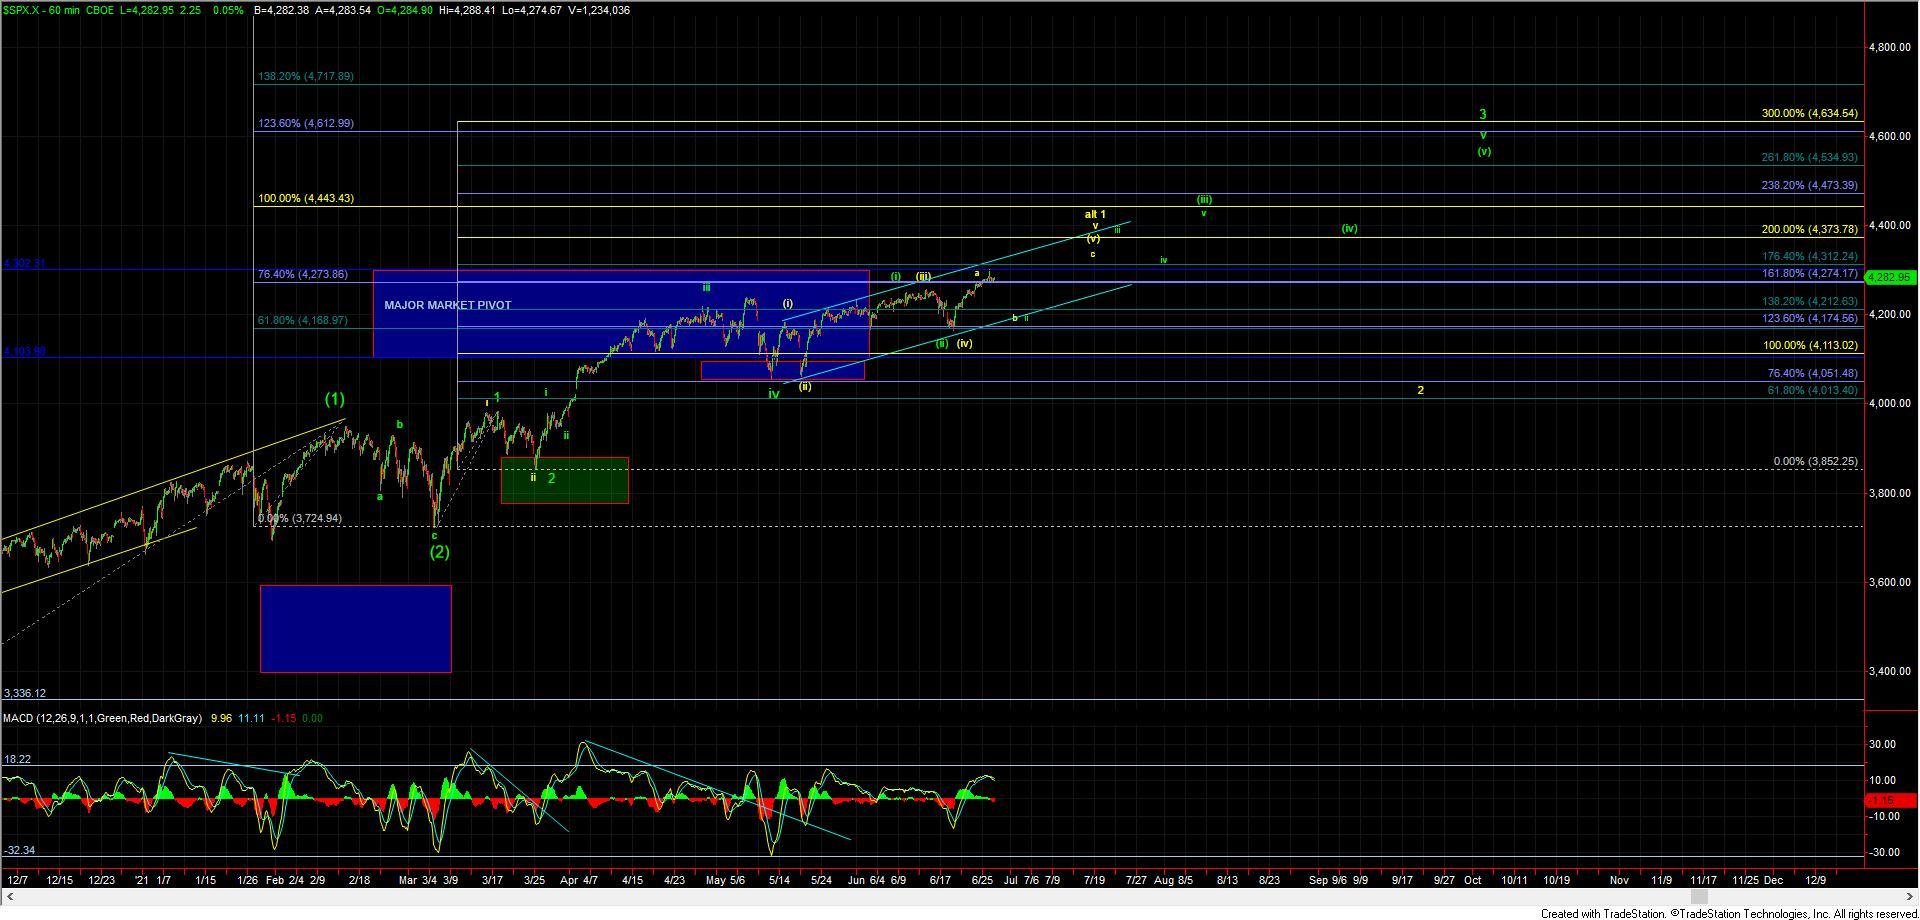
In either case, after getting this five-wave move up off of the lows a corrective retrace will provide us with a clear and well-defined buying opportunity. From there we can then simply use our Fibonacci pinball guidelines to provide further guidance should the market indeed follow through to the upside. We will be able to layout those price pivot levels along with support levels once we see where we actually pull back to and then push to new highs. I will note that I am likely going to be viewing the 4320-4370 zone as a fairly key pivot zone that should help signal a breakout per the green count. Moving through that zone then would likely keep us on track to move into the 4500-4600 region for the wave 3 as shown in green on the 60min SPX chart.
So with that and until we see the pullback for the wave ii take shape on the SPX we really are still positioned in a very similar spot that we were last week. We should however really start to see that pullback take shape this week if it is indeed going to occur as we are starting to run out of room overhead for this to continue to push much higher.