Path Of Least Resistance Seems Up
 By
Avi Gilburt
By
Avi Gilburt
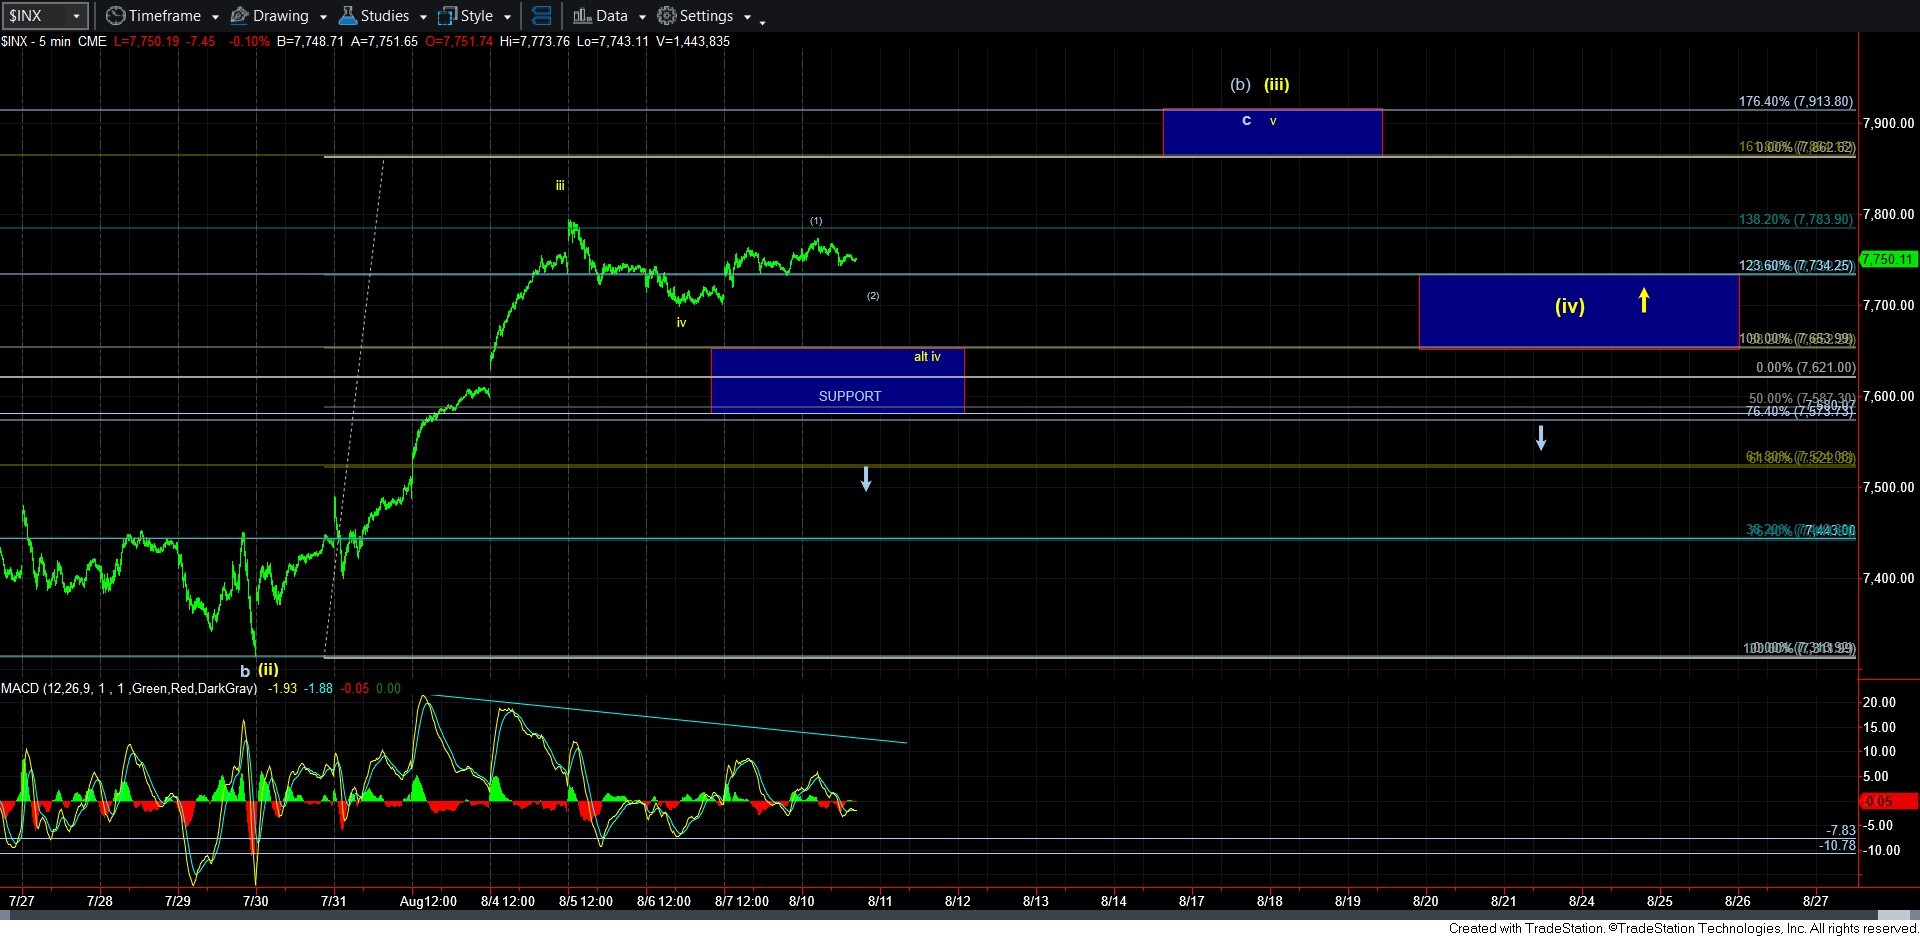
With the lack of any bearish indications thus far, and the fact that we are clearly over support, it suggests that the path of least resistance is to the upside. And, our next target is outlined by the box overhead on the 5-minute SPX chart in the 7864-7914SPX region. This represents the 1.618-1.764 extensions of waves (i)(ii), and is the typical target zone for wave (iii).
In the very micro structure, I an make an argument for a (1)(2) to be developing within wave v of (iii). Clearly, we need to hold support over 7698SPX for this to be applicable. Any break down below that support suggests that wave iv is not yet done.
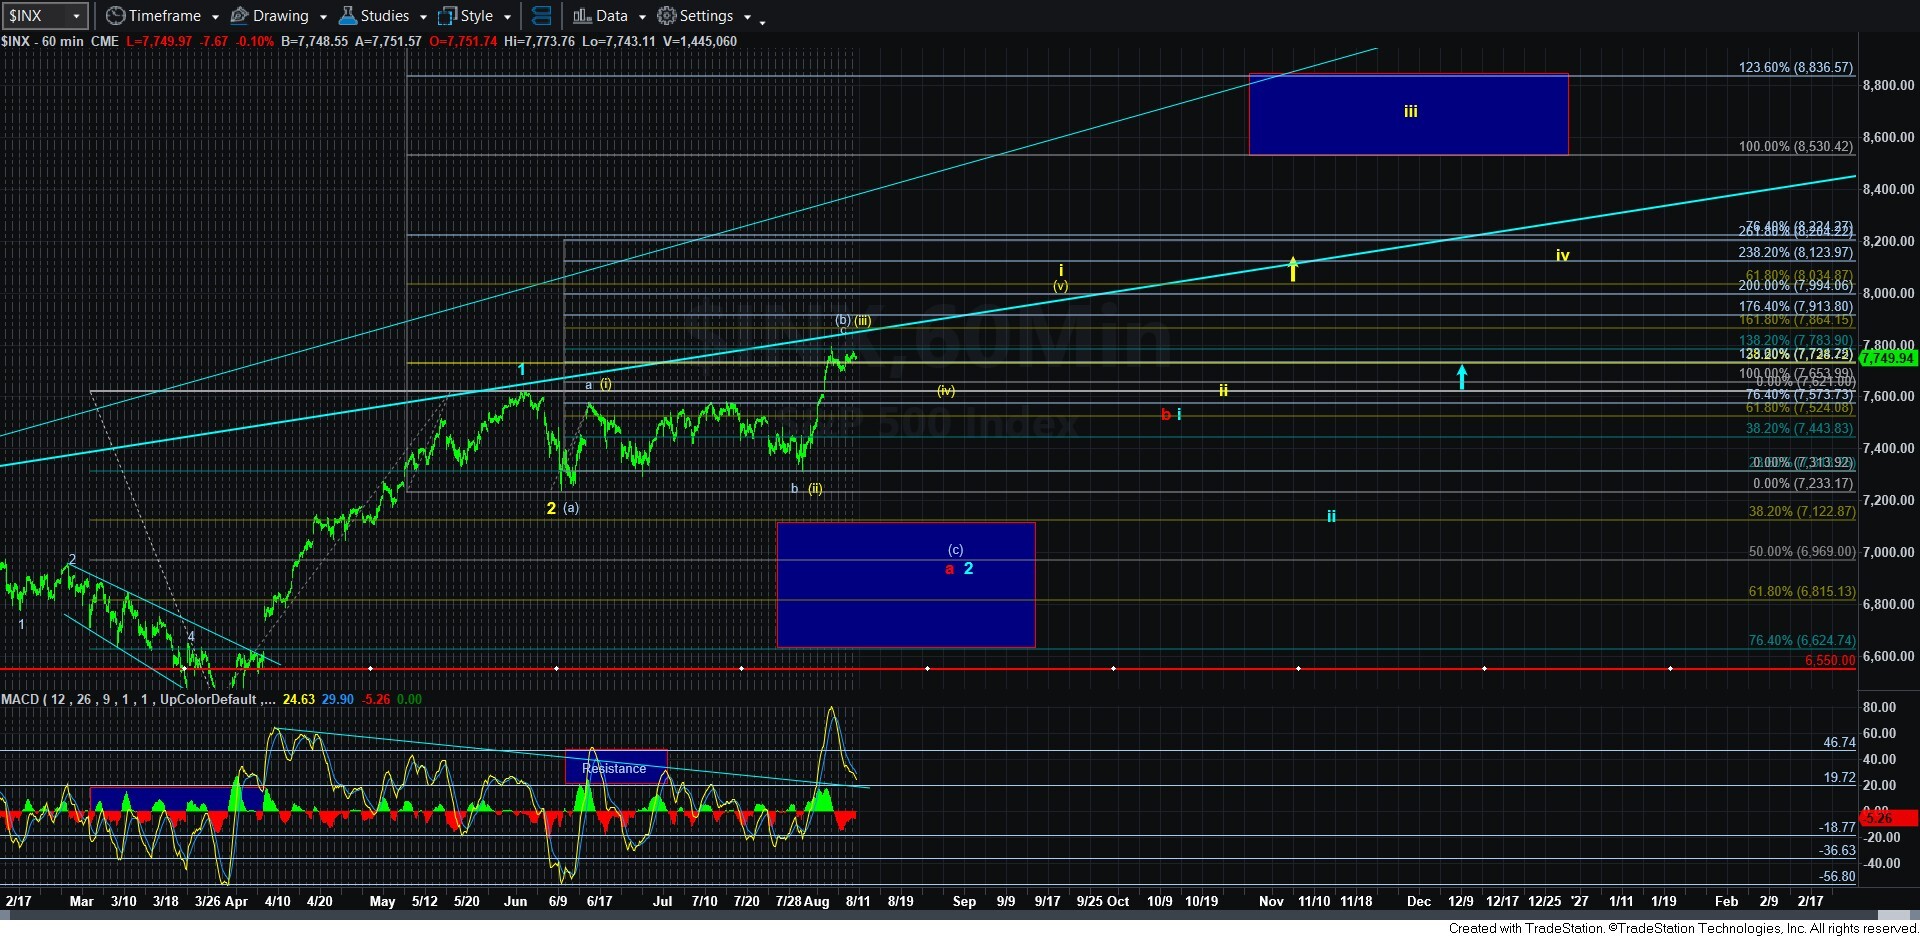
Again, I want to remind you that we can still rally to that next target and still be a (b) wave, as we would not have yet completed 5 waves. So, that is going to remain our alternative count. It will only become a primary count in the event we break support. And, as long as we hold over support, we have to give the market the opportunity to complete all 5 waves up for wave i of 3, as shown on the 60-minute SPX chart.