Path For Yellow - Market Analysis for Sep 22nd, 2026
 By
Avi Gilburt
By
Avi Gilburt
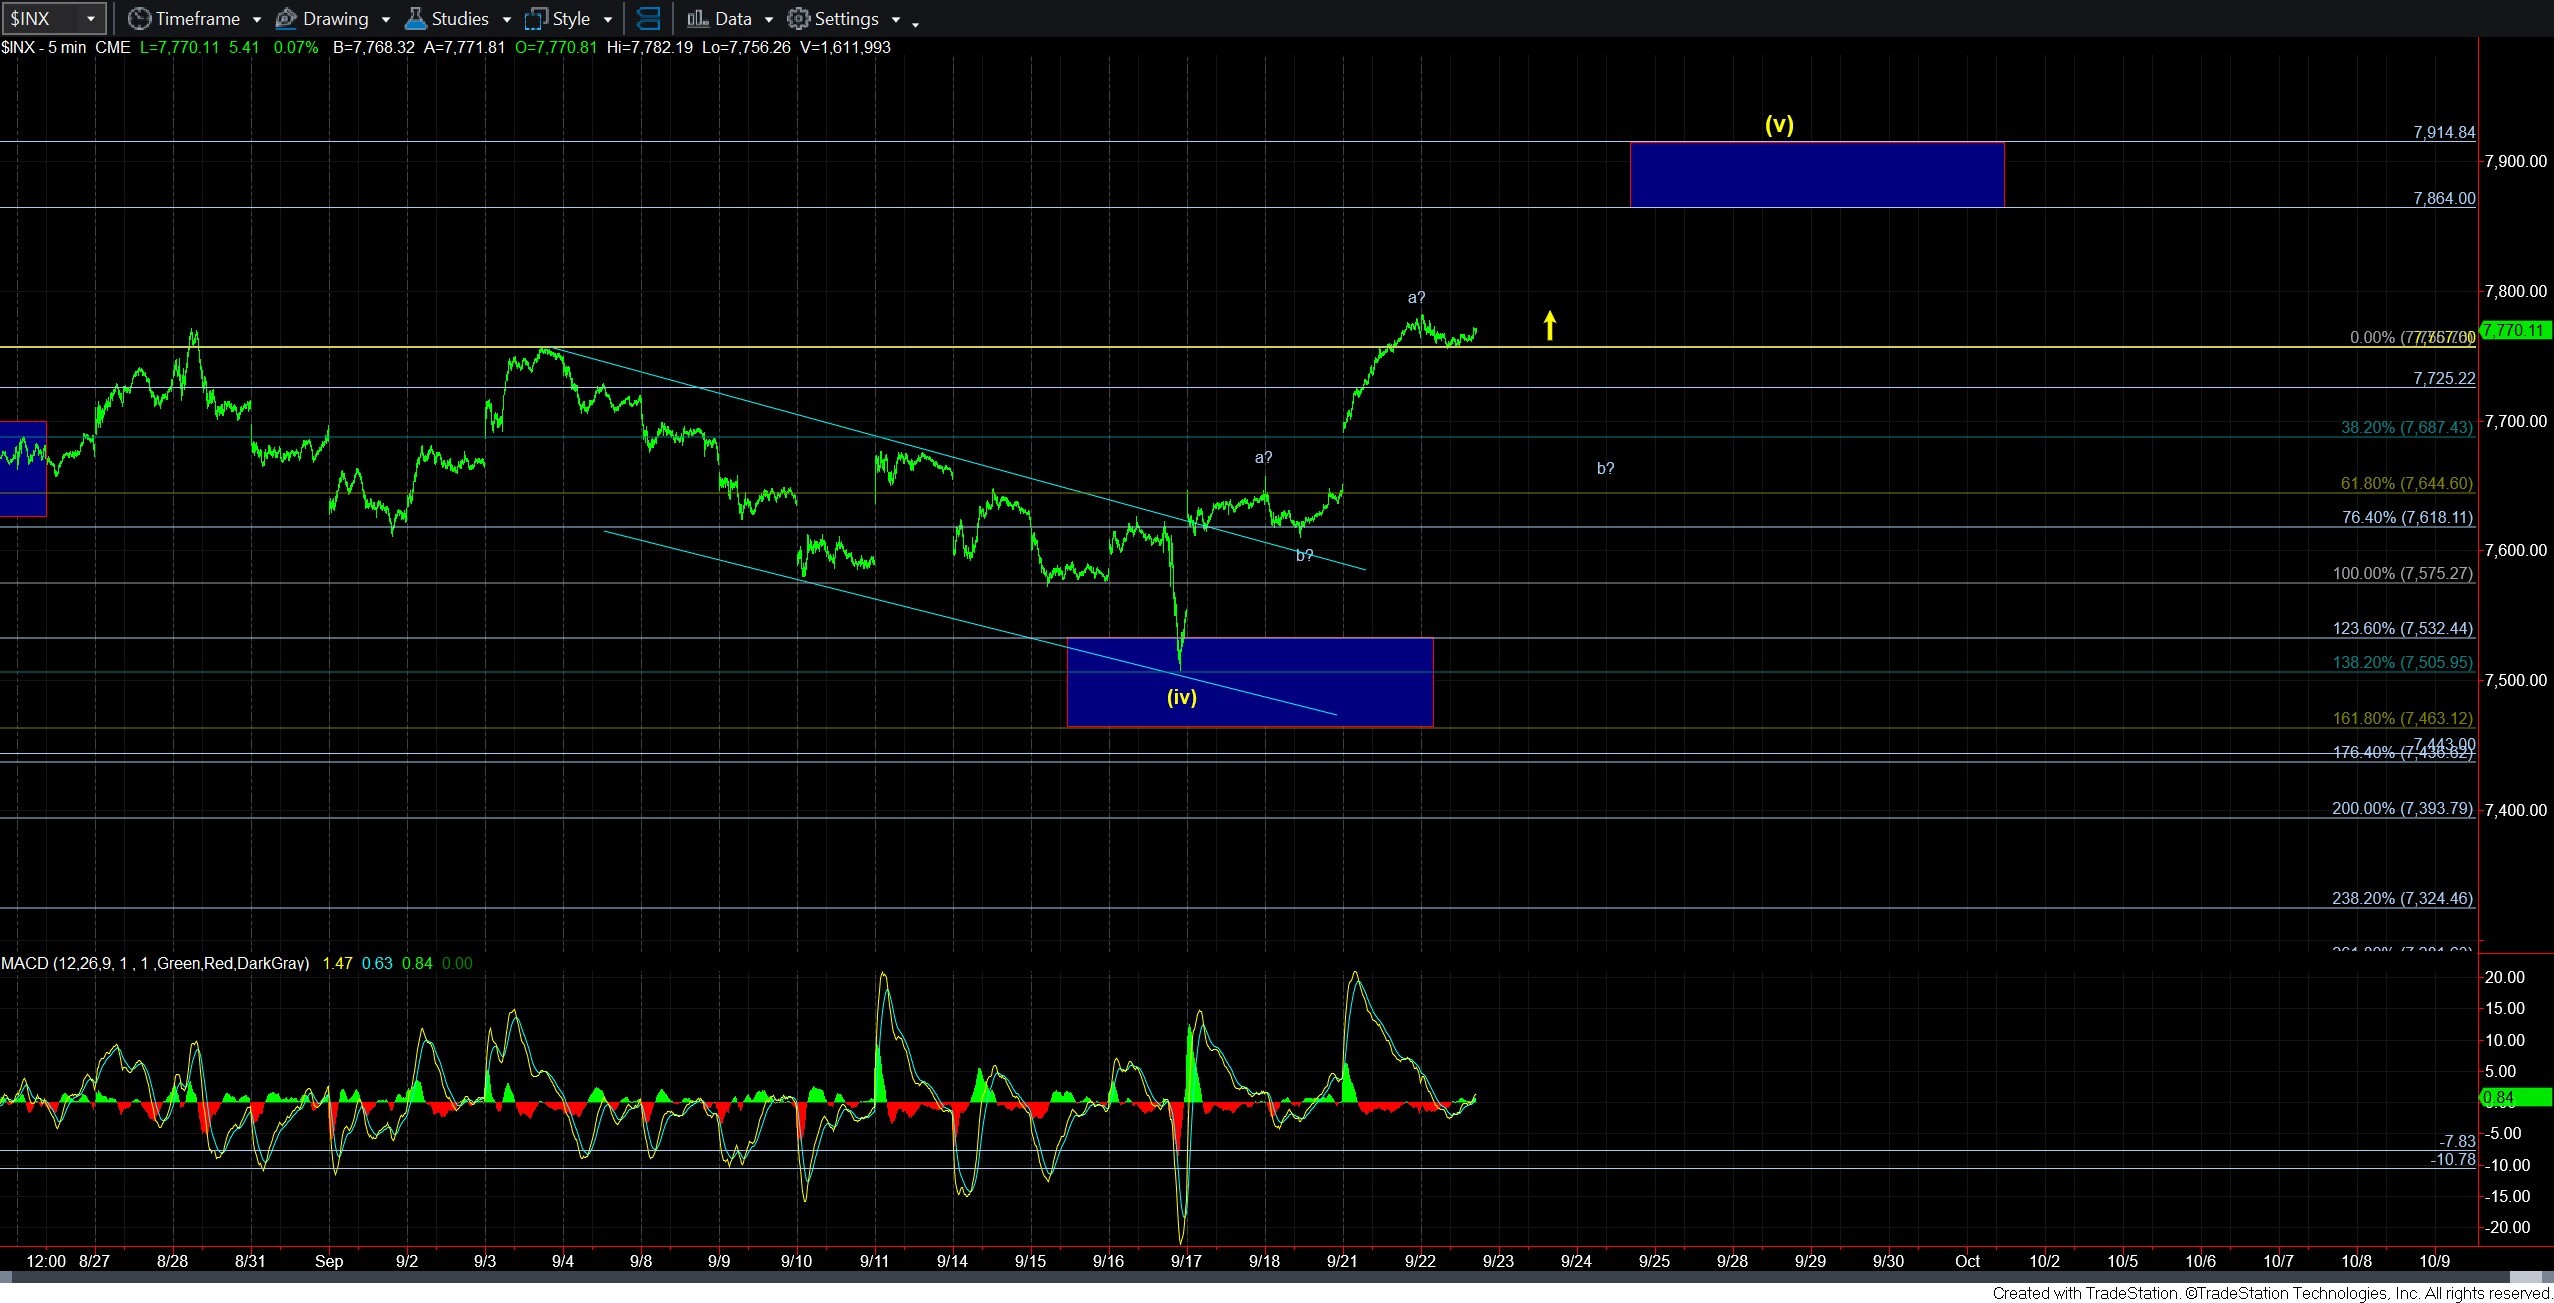
As I noted earlier today, the market has taken out resistance, which forces me into the yellow count, as the blue count has invalidated. That means we are now tracking a diagonal off the wave 2 low for wave i of 3. And, within that diagonal, we are in wave (v).
Remember that the huge majority of diagonals develop with 3-wave sub-structures. That means that this will likely be an a-b-c rally. So, as I noted on the attached 5-mintue chart, either the a-b is already done, or we have just begun the b-wave pullback. Based upon the manner in which this market has been acting for the last several years, I have to assume we are going to attempt a more direct path to the wave (v) target of 7864-7915SPX. And, as long as we remain over 7725SPX, I am going to maintain that assumption. A break down below 7725SPX would suggest otherwise.
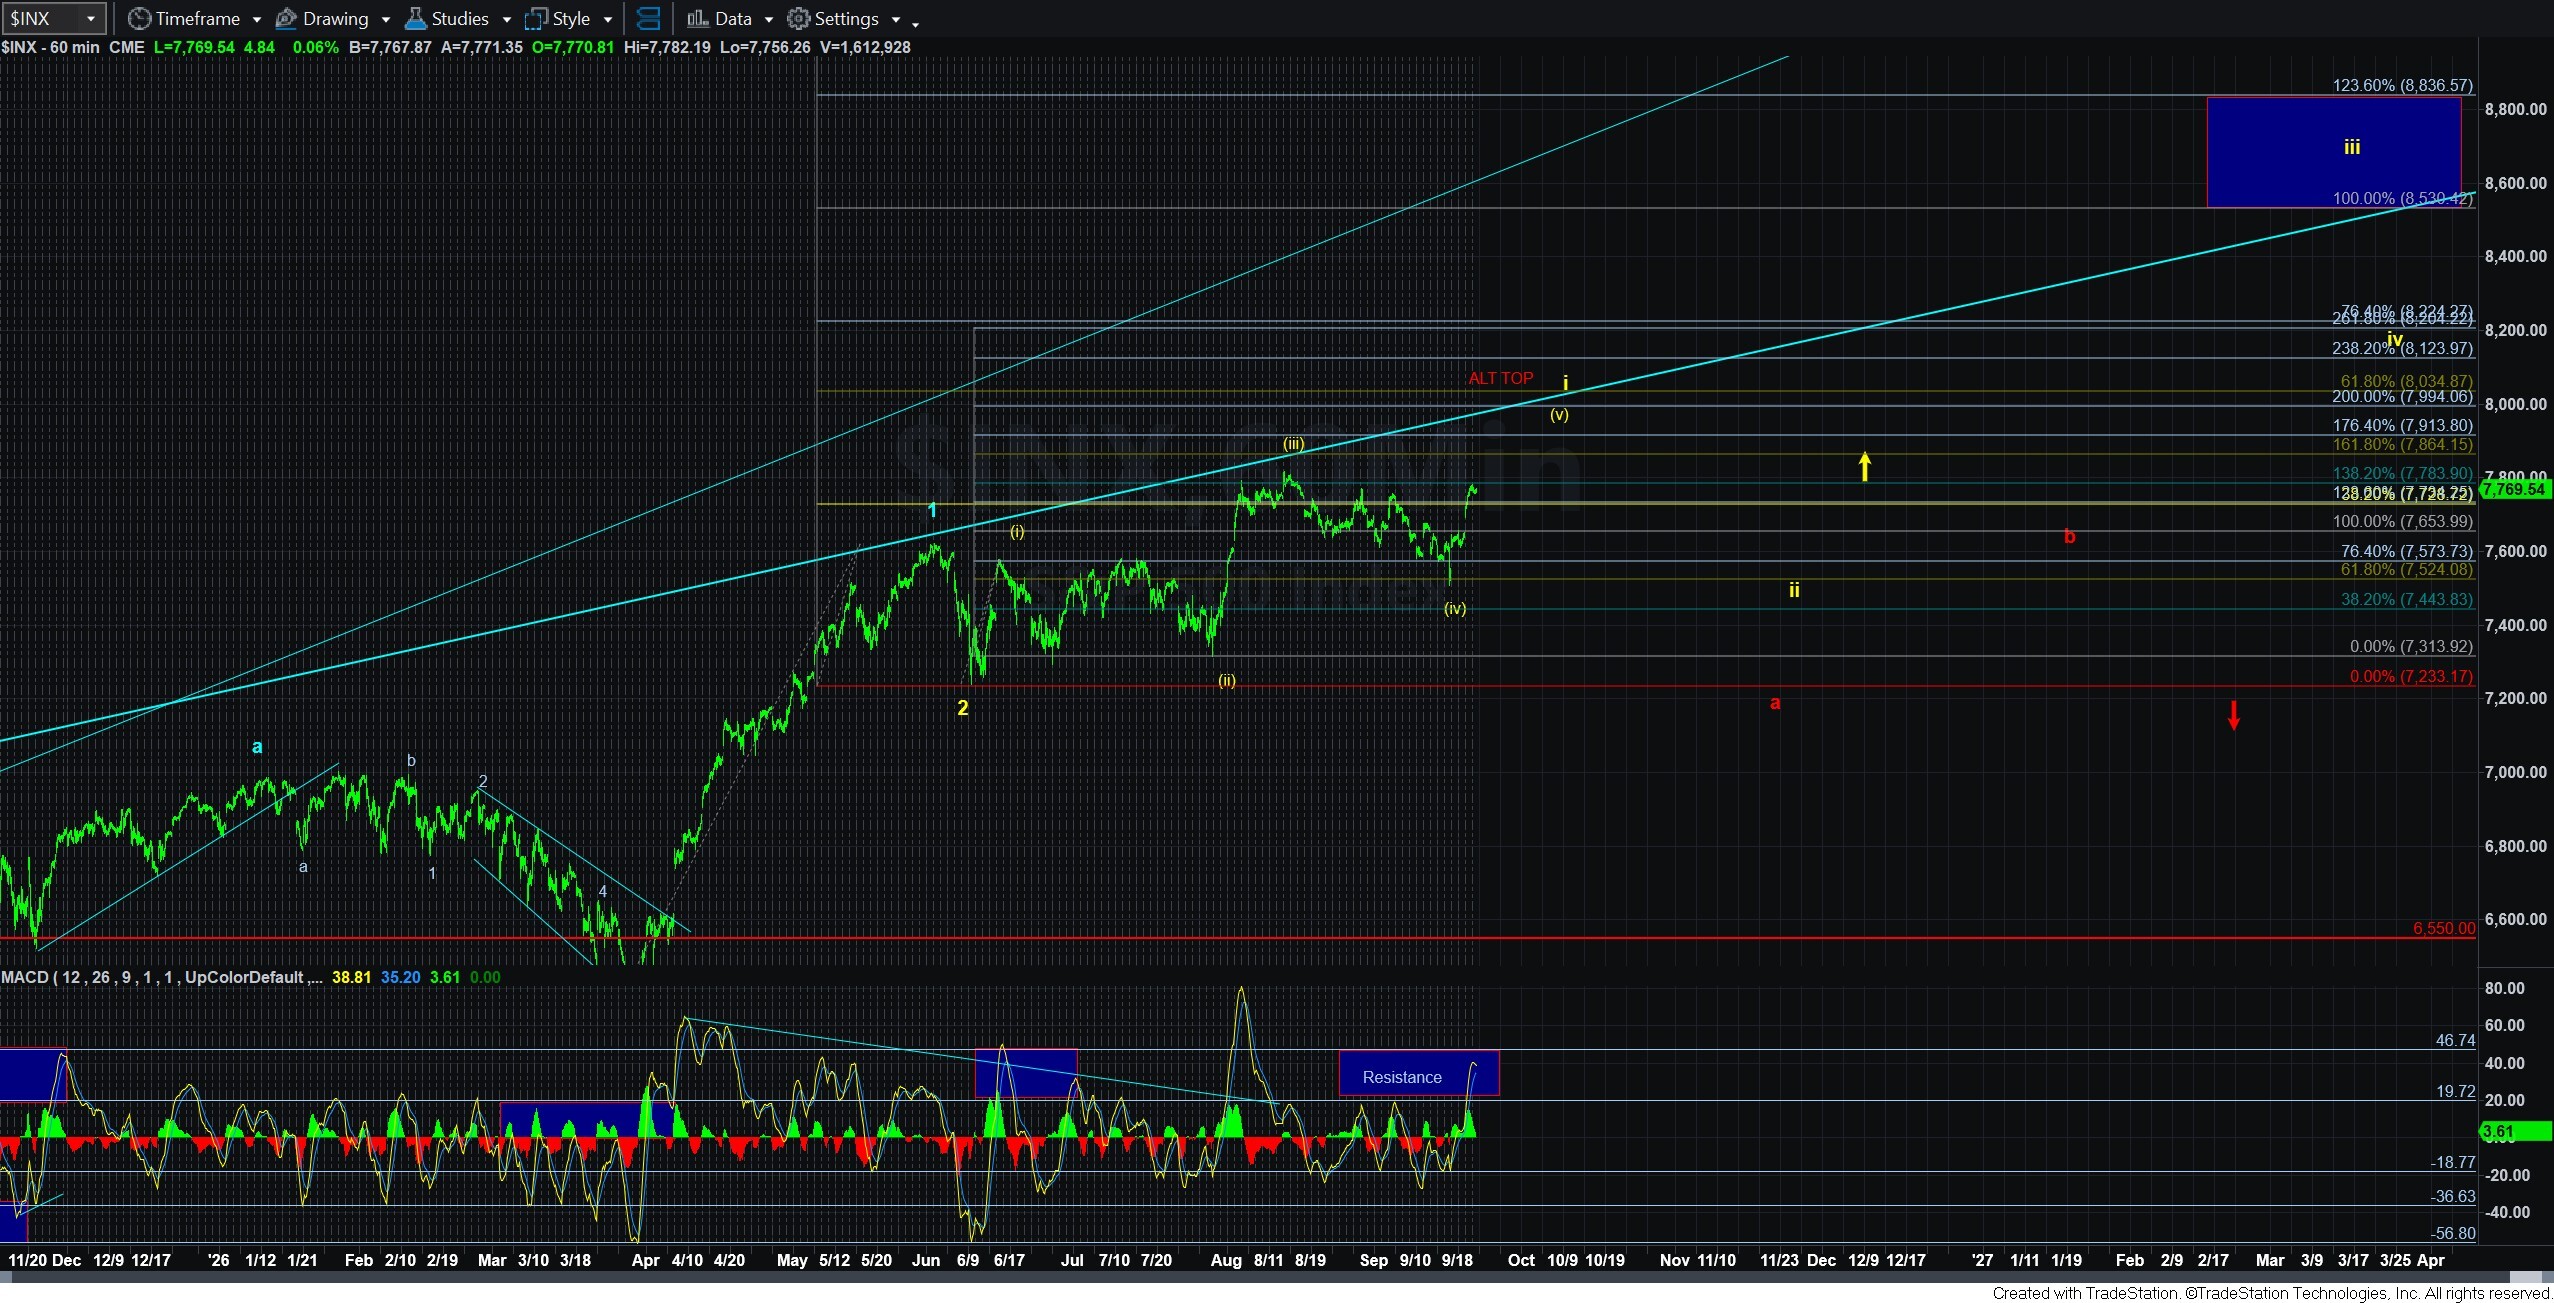
As far as where we are now in the bigger picture, well, please see the 60-minute SPX chart. I am now left with two main wave counts. Clearly, we are tracking the yellow count. In this count, we would expect a corrective wave ii pullback to set up a wave iii of 3 rally to the target box above on the 60-minute chart.
Alternatively, we clearly have enough waves in place to consider this entire long-term pattern complete. And, if so, then we are completing a very large ending diagonal from the 2020 lows. That means that the reversal “should” be very strong if this is indeed completing a diagonal. And, since this last rally off the March low is a diagonal as well, I would assume that the strength of the reversal will tip the scales in favor of the red count once it begins. But, please do not turn bearish too quickly if we do see a strong reversal. We will need to see a break down below the start of the yellow wave i (which is the bottom of wave 2) in order to confirm that potential. That level is 7233SPX.
So, for now, I am going to patiently await the completion of this wave (v), and will watch the nature of the pullback thereafter. If clearly corrective and suggesting that wave ii is in progress, that would turn out to be a buying opportunity, with stops being placed at 7223SPX.
Lastly, if you are asking yourself if this micro structure which is now taking shape can be something other than what I am outlining, the clear answer is yes. When dealing with 3-wave structures, it leaves many doors open. In fact, I believe Garrett had one alternative such paths on his chart yesterday. But, for now, I believe these are the two most likely paths.