Parameters In Place For Continued Push Higher Into The End Of The Year and Beyond
 By
By
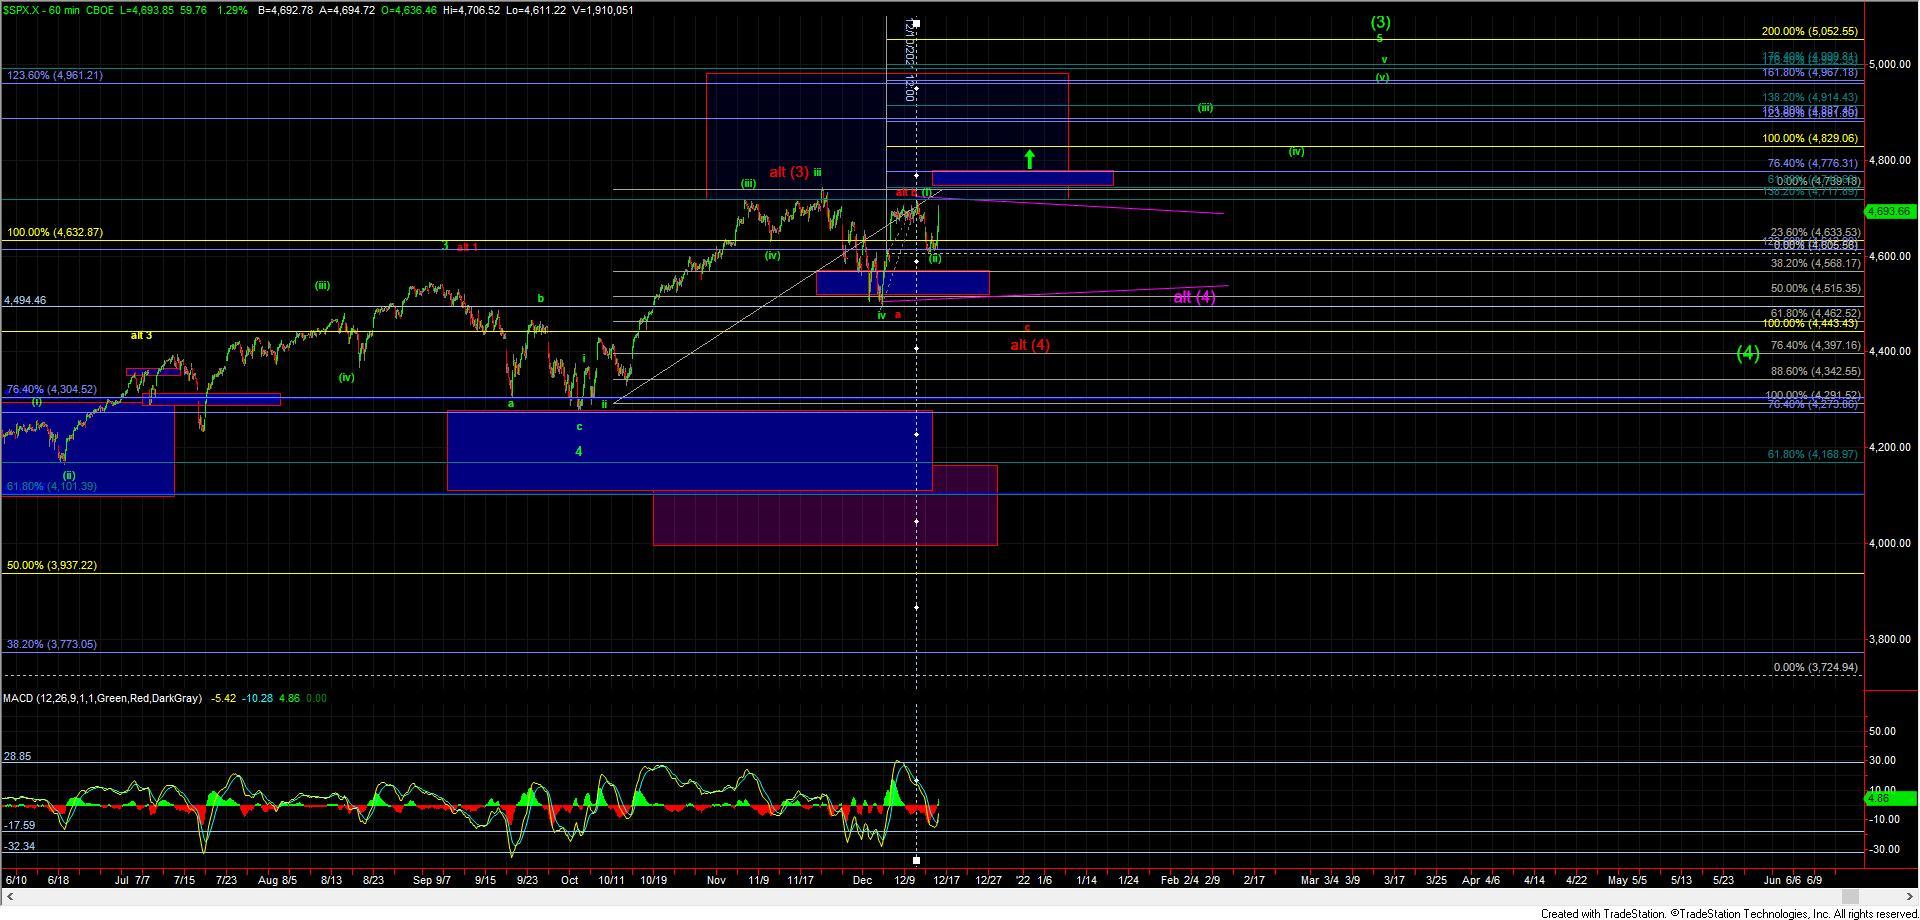
For most of the morning and early afternoon, we saw the markets hover near the lows that were struck yesterday as we waited for the FMOC meeting to conclude. Those lows of course were at a key support level on both the ES and the NQ charts which I had laid out for several days with the ES sitting right at the 50% retrace level from the initial move up off of the December 3rd low. That move off of the December 3rd low and into the December 10th high I had been counting as a five-wave move for a wave (i). So with that being the case, the retrace that began yesterday was being counted as the wave (ii) of that larger wave v of 5 of (3) which should ultimately target up towards the 5000 are on the SPX. This path was and still is shown in green on both the ES and SPX charts and was and still is the primary count. Thus assuming we follow my primary and base case I expect to see this push higher into the end of the year and into the early months of the near year. Yesterday we were simply waiting for a five-wave move of one smaller degree to form off of the bottom of the wave (ii) to give us further confirmation that the wave (ii) of the green path had already put in a bottom.
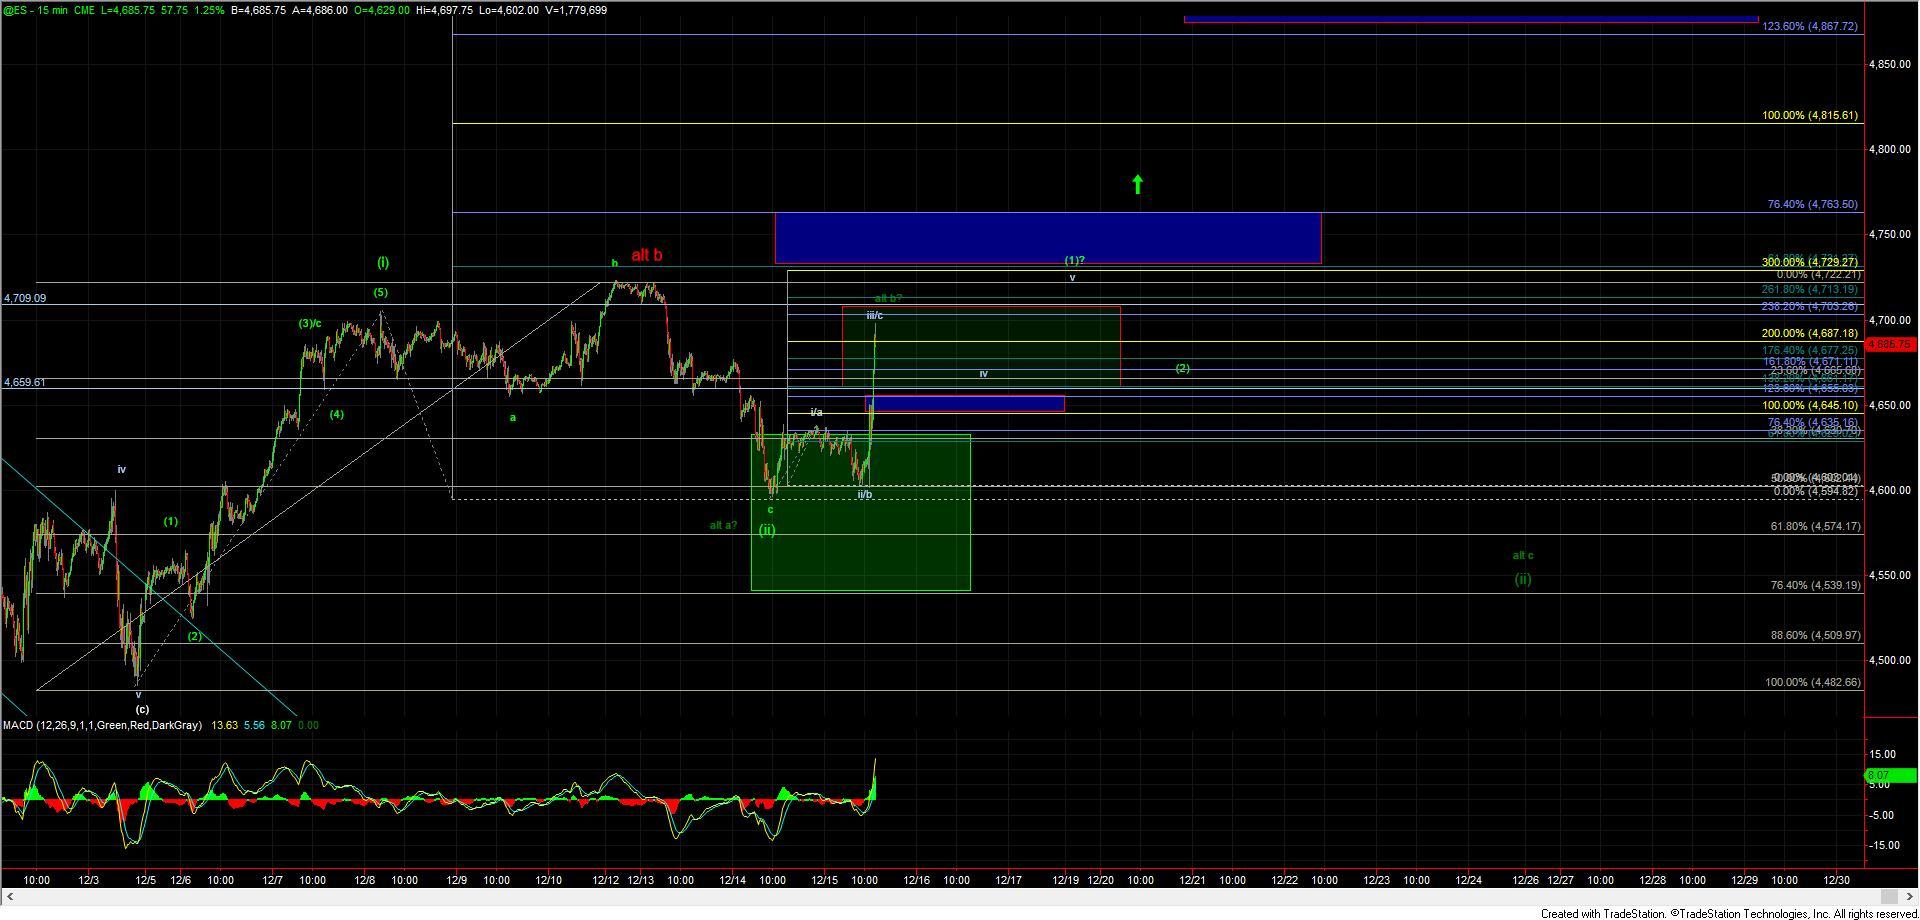
Today after the FMOC meeting we saw the market waffle a bit near the lows but as we entered the final hour the market spiked sharply higher. This spike is certainly a good sign that we have indeed bottomed in all of that wave (ii) which can be seen on the 60min SPX chart as well as the ES charts. With that being said that move up off of the lows still only has a three-wave structure in place so far. So this still leaves the door open for the ES to push lower back under today's LOD at the 4602 level to give us a larger wave c of (ii) before finding an ultimate bottom. This however is not my base case at this point in time and I am leaning towards the bottom of all of the wave (ii) to be in place.
To give us that final confirmation that a bottom is indeed in place I want to see this consolidate for the micro wave iv and then get another push higher for the wave v as shown on the ES chart to fill out the wave (1) of larger wave (iii). Support for that wave iv currently comes in at the 4655-4645 zone on the ES chart and as long as that zone holds my base case will remain that we have bottomed in all of the wave (ii). Should that 4645 level break BEFORE we get a full five up off of today's LOD, then it would open the door for this to sill be topping in a wave b needing another wave c of (ii) down before finding a bottom and pushing higher towards that 5000 region into the new year.
Assuming we can indeed get that wave (1) to fill out as shown on the charts I would then want to see a wave (2) retrace that should then be followed by a strong push higher for the wave (3) of (iii) up. We should then see a break over the next key overhead pivot at the 4729-4763 zone which will give us further confirmation that a bottom is indeed in place and the Santa Rally is fairly underway.
As far as the red alternate path is concerned, If we are unable to hold the 4630-4539 support zone and push below that level then it would suggest that we may have topped in a wave b of (4) as shown in the red path still needing a deeper push lower before this finds an ultimate bottom and pushes to new highs once again. As I noted yesterday however the structure up off of the lows however is not very conducive to this red path and I am not viewing this as highly probable at all. I am however going to leave it on the charts for the time being as this is the most straightforward alternate path that has the potential for this to still see new lows at the moment. The purple triangle count will also still remain on the board as an alternate path until we can take out the 4722 level but as the red path, I am not viewing this as highly probable at this point in time.
In summary, this has been following the path that we have laid out very well over the past week which has been shown in green and the green count was then and now remains the primary path forward. I expect to see the market move higher into the end of the year and into the new year unless we start to see a major break of support which comes in at the 4539 level.