Overlap Has Made This Overly Complex
I have probably said this at least a dozen times thus far, but the reason I am still being cautious is because of the overlap we have seen in November, as well as the almost non-existent wave [2] the bulls have to now rely upon if we really are heading to 4000+ directly.
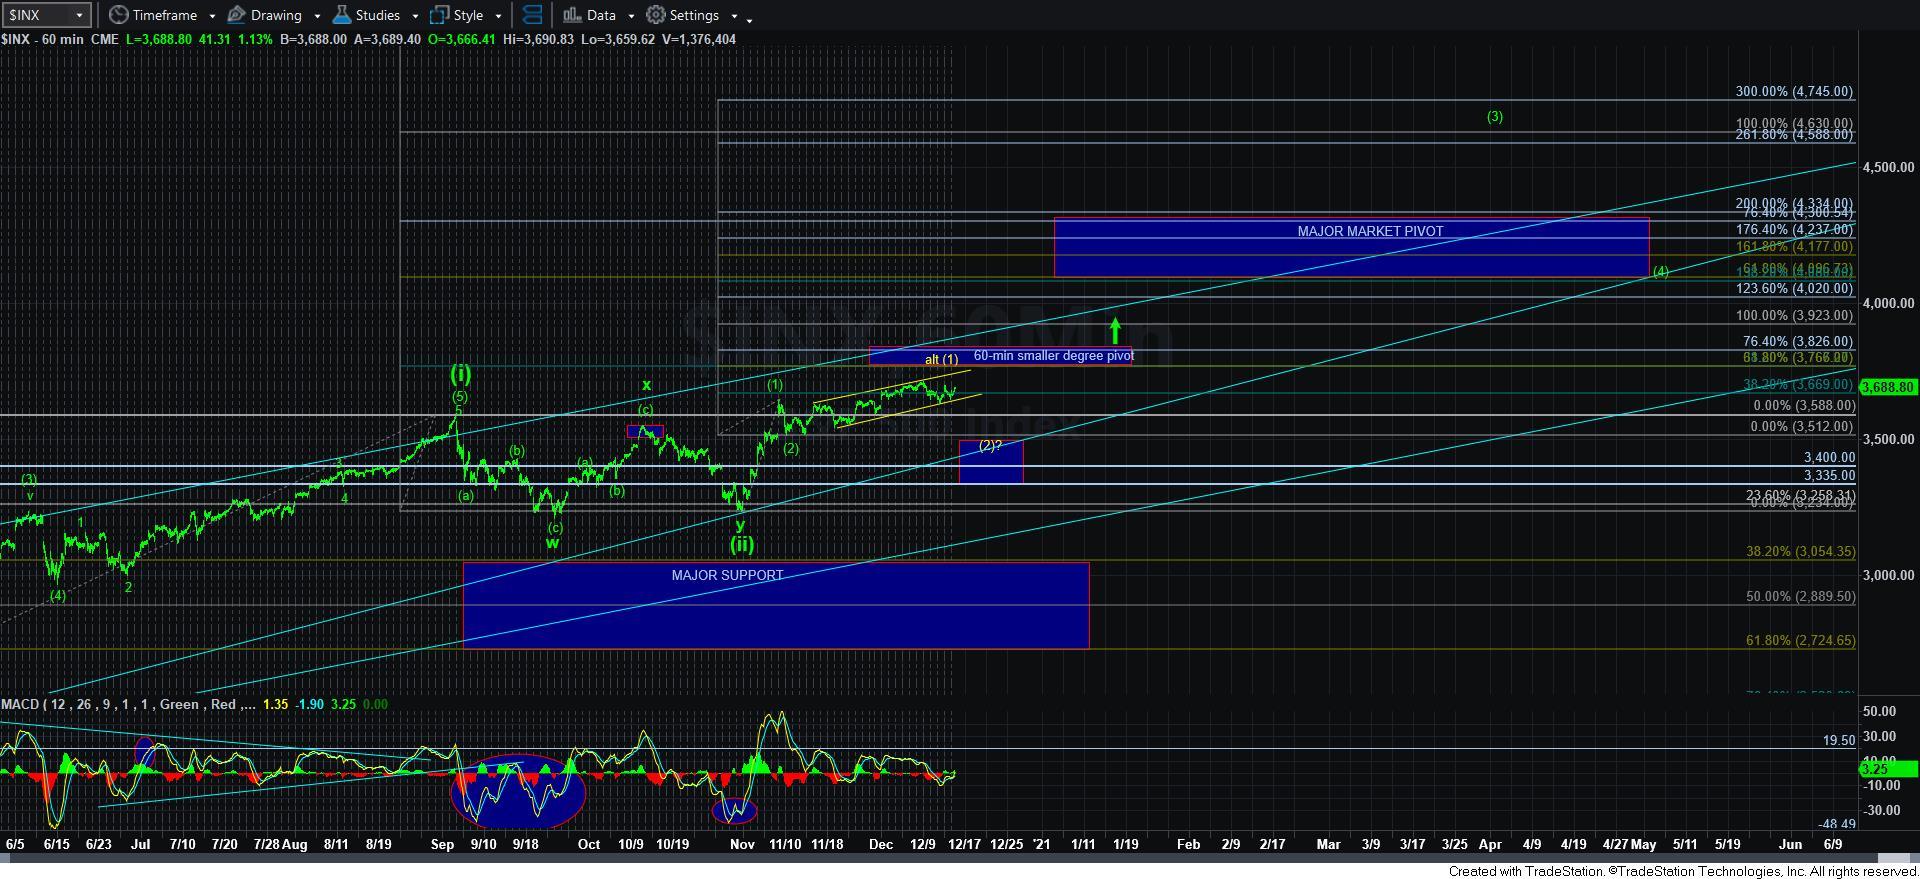
You see, the action we have seen at the end of last week and into this week can still suggest that an ending diagonal for the 5th wave of the yellow wave [1] is not yet completed. That would suggest the low we struck last week was the bottom of wave 4 in that ending diagonal, with us now rallying in a-b-c fashion in wave 5. It is for this reason that I am monitoring support and resistance levels on several time frames throughout the day.
Also, I am going to get a bit more nuanced in this update, as I am going to focus on the two smaller degree wave structures I have been outlining during the mid-day updates. And, when I repeat that you must know your timeframe, I am hoping this update can provide a bit more insight into what I really mean when I say that you need to understand the various timeframes that we track with our EW analysis.
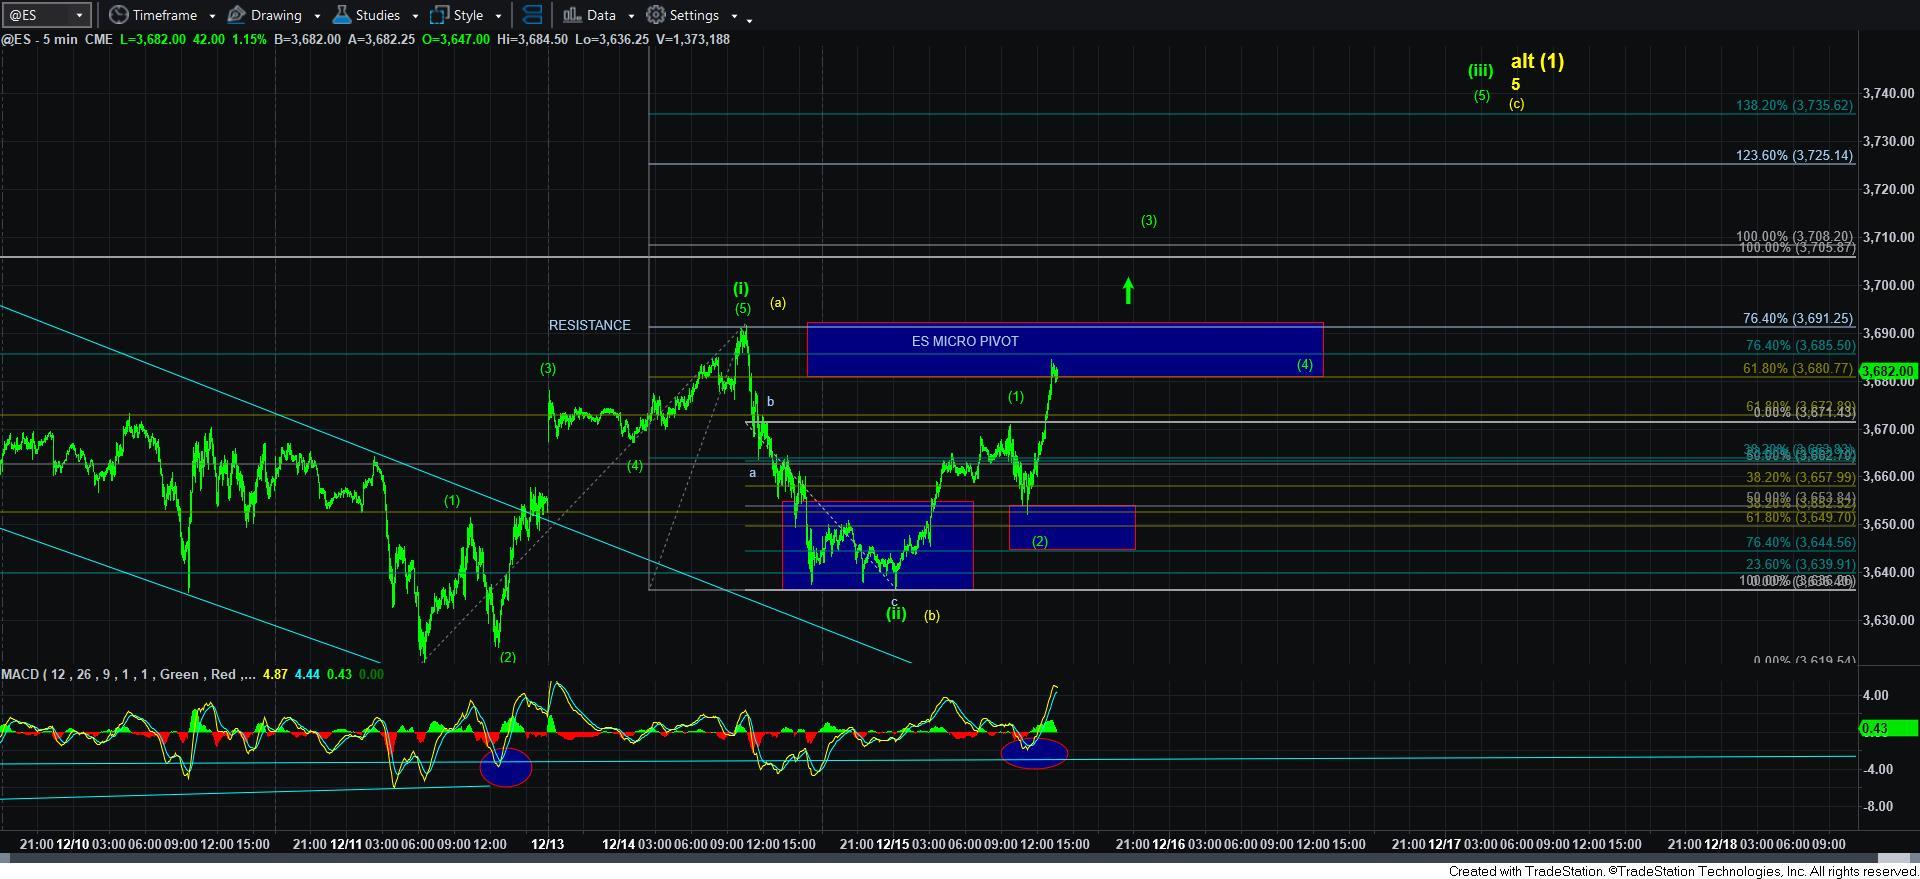
Yesterday, the market rallied right to our resistance point, and then pulled back as I outlined in the intra-day updates. Moreover, we pulled right back to the bottom of the support box I outlined, and have begun this rally off that low.
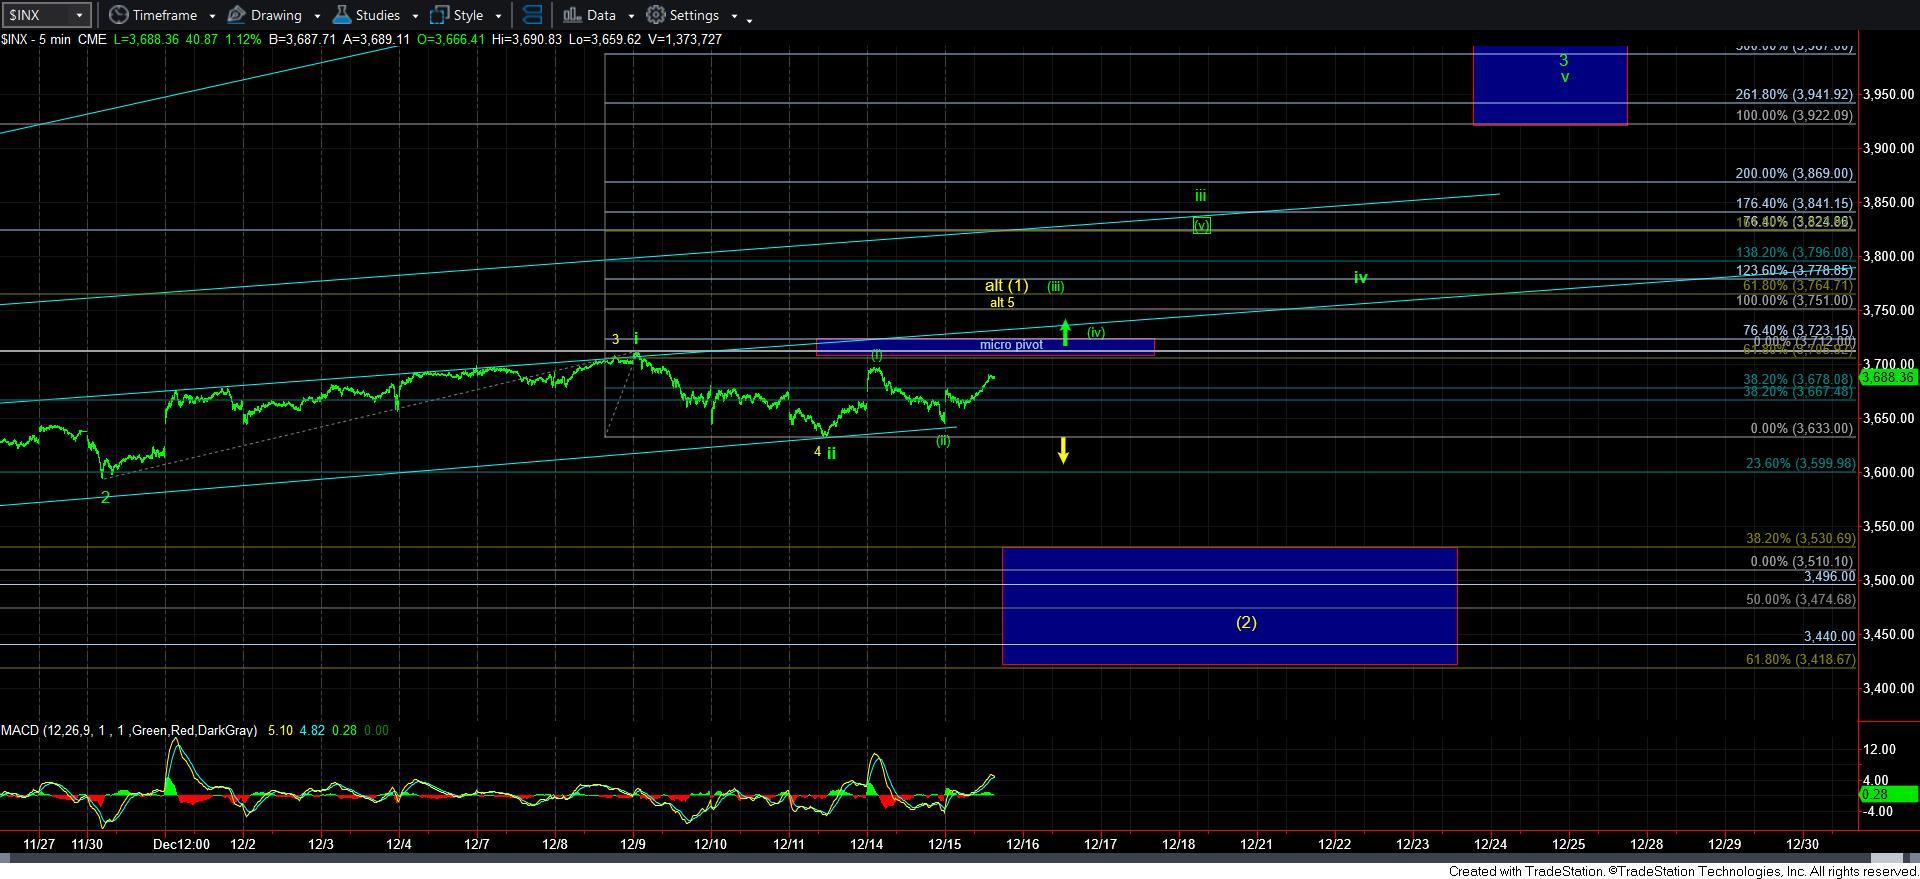
If we zoom out a bit on the 5-minute chart, you will see that the low we struck yesterday is a key support for the market right now. As long as we remain over that low, pressure will continue higher to a new all-time high. However, if the market does turn down before that occurs, and follows through below the yellow wave 4, then it is clear we are going to continue much lower into the target region for the yellow wave [2].
Keep in mind that the 5-minute SPX chart is focused primarily on the wave degree presented by the green i-ii structure within green wave 3. So, it is focusing in on one wave degree higher than the attached ES chart.
So, when we move in a bit closer into the smaller degree structure as outlined in the 5-minute ES chart, we are focusing in on the next lower degree than the 5-minute SPX chart – specifically, the [i][ii] structure within wave iii of 3. That shows us that todays low is an important micro support for micro wave [2] within [iii] of iii of 3. And, if the market is truly bullish, we should not even approach that support again, as we head up to at least the 3705ES region next.
So, as you can see, I am going to continue to follow the more bullish pattern primarily, at least until we see it faulter and suggest the yellow count is beginning to gain in probability. But, as I have noted in the past, if the market should faulter, please be prepared to change gears once the market tells us that a larger and more appropriate yellow wave [2] is taking shape.
The market has been rather clear in providing parameters even though it has not slammed the door shut yet on the potential for a wave [2] pullback. But, if we are indeed going to accelerate in the heart of wave 3, then we should start seeing some breathtaking extensions begin to take hold, coupled with shallow pullbacks. So, from this point forth, any break of support is going to be a near term warning that a larger pullback will still likely be seen for a more appropriate wave [2] base from which we can more confidently rally to 4000+ into 2021. I will continue to adjust support levels as we move through the wave structure progression.