One More Push Higher
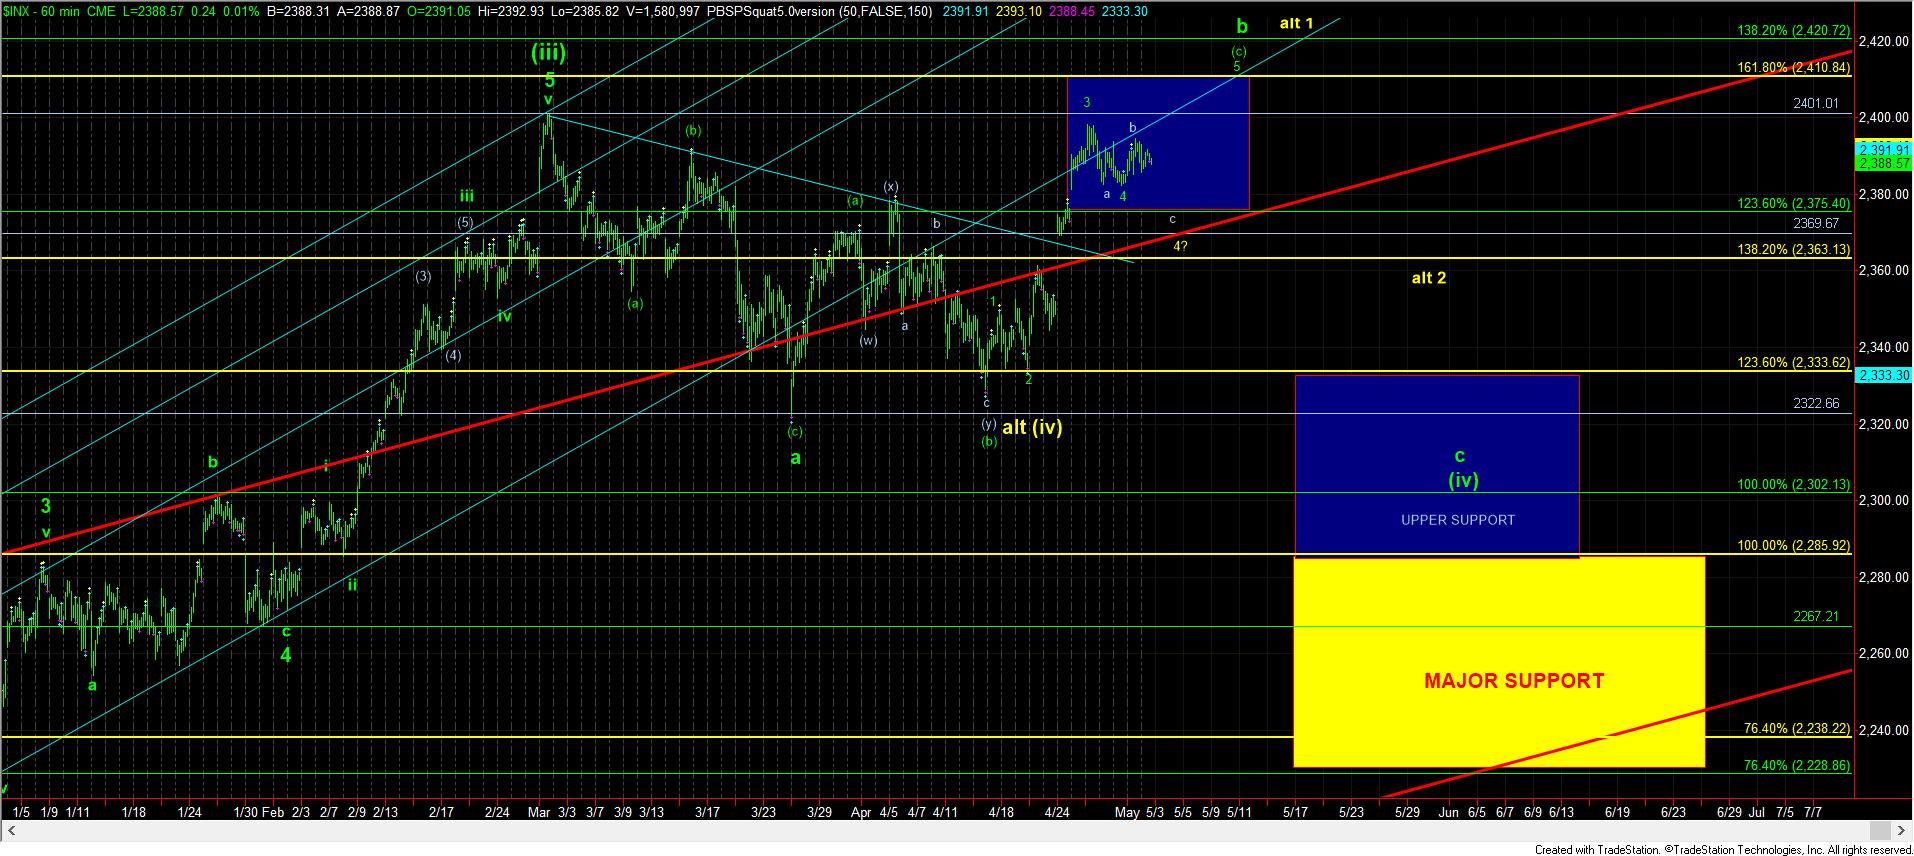
The SPX has been in a rather sideways-type move since we struck the wave 3 high on the 26th of April. Since that time, we have counted this pullback as wave 4 within a (c) wave of a b-wave of a larger degree wave (iv), as you can see from the 60-minute chart.
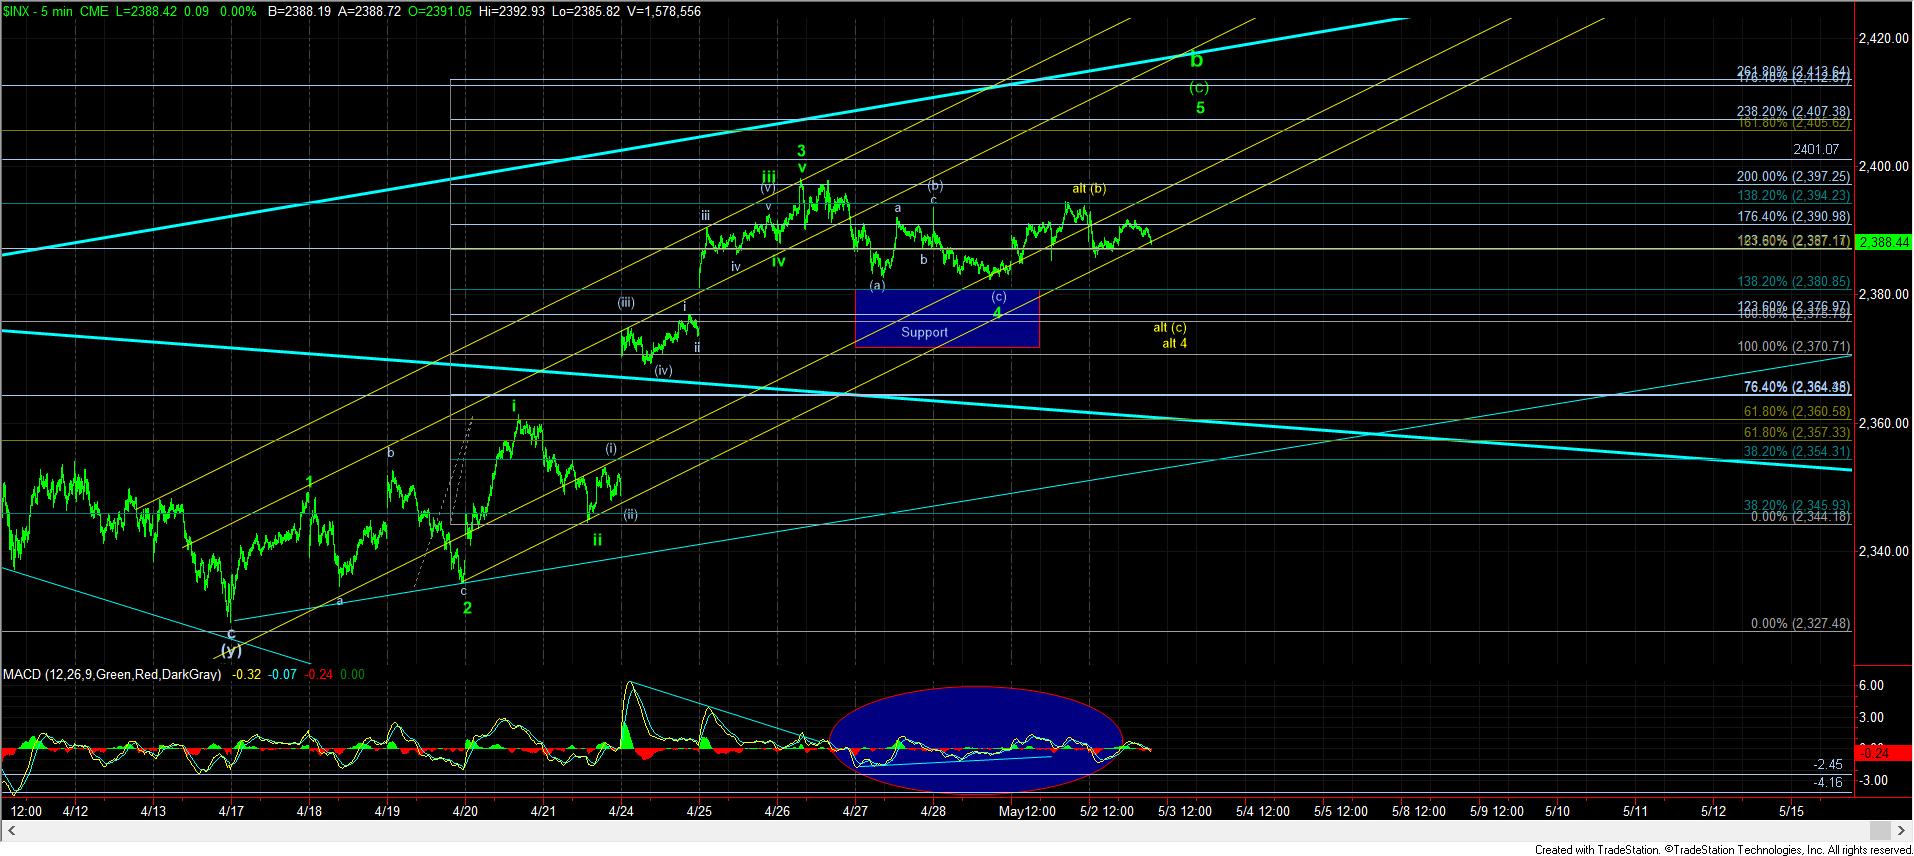
However, it is not clear whether wave 4 has concluded. The move up off Friday’s low in the cash index is quite overlapping, and can easily be counted as a b-wave rally. That means that we can still see a smaller degree (c) wave down in wave 4 going into tomorrow.
On the micro count, we would need to see a sustained break 2387SPX to begin to look lower in a more protracted wave 4 in this (c) wave, which would then extend the top to this b-wave rally until next week. However, if we are able to break out over yesterday’s high, then it suggests that we are already in wave 5, which can still complete by the end of this week.
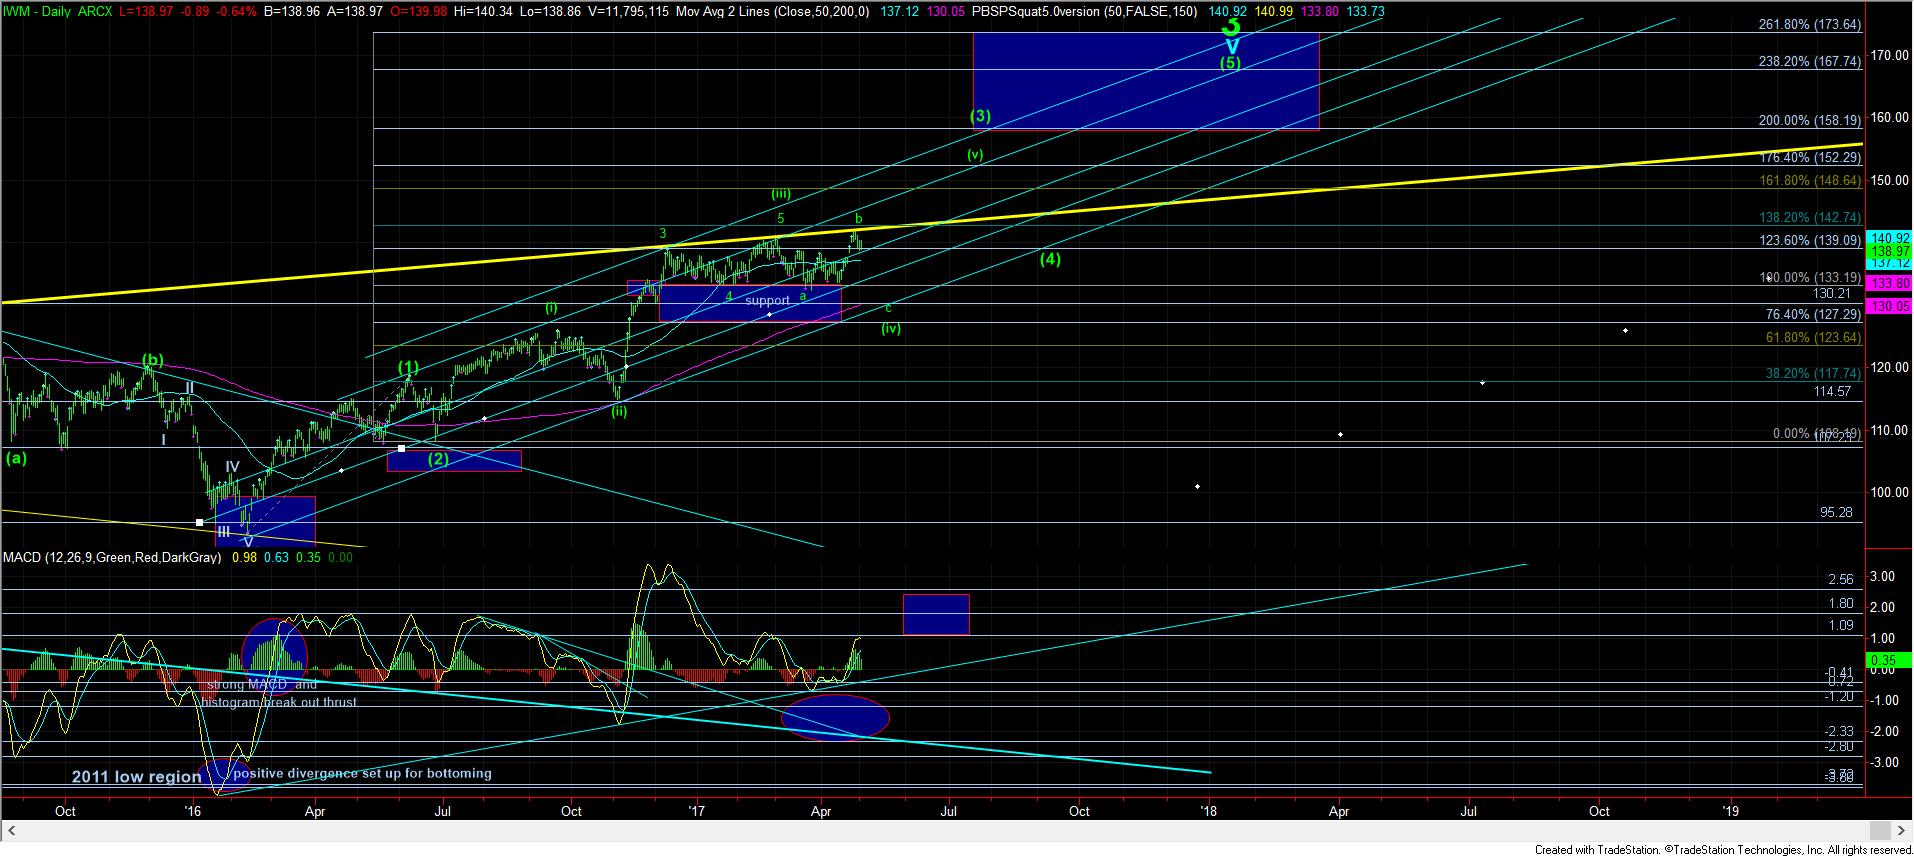
I also want to add that the Russell index may have provided us with a topping signal already. Today, Zac posted a chart which shows a potential 5 waves down off the recent high in the IWM. That suggests that the IWM is leading to the downside just like it lead to the upside. It means that the IWM has already provided us with wave 1 down in the larger degree c-wave of wave (iv), and the next rally will likely only be a 2nd wave rally in the Russell index, whereas the SPX will likely see a higher high in a 5th wave.