One More Lower Low Coming Or Did We Finally Find A Bottom?
 By
By
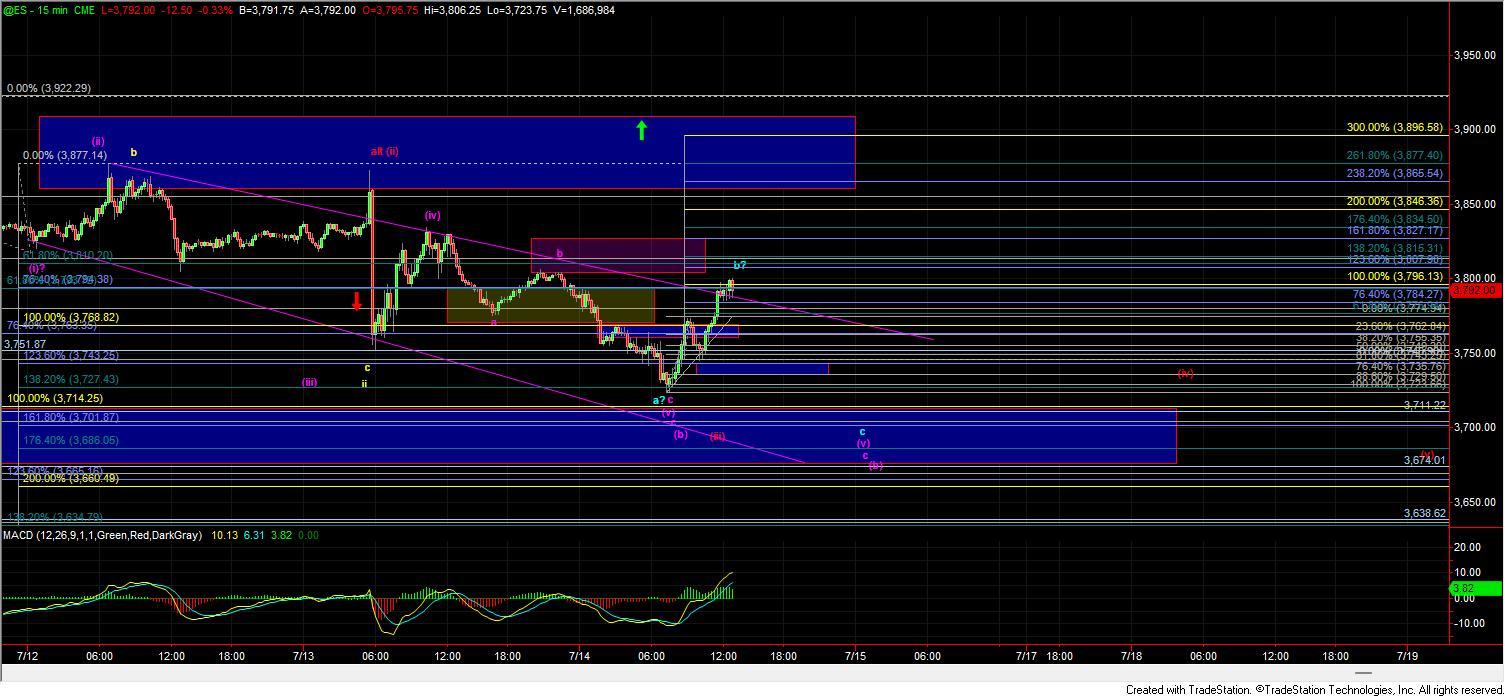
Today we saw a similar theme as yesterday in that we pushed sharply lower in the morning session only to reverse much of those losses and press back higher into the end of the day. Today's push lower did finally invalidate the yellow count and left us only with the purple and red counts with the purple being the clear primary count. As I noted yesterday the purple path is likely taking the form of an ending diagonal which means that all of the subwaves are going to be three-wave corrective moves both up and down which does make it a bit more difficult to track. With that said once that Ending Diagonal is completed the reversal out of the ED should be very sharp and swift with the initial move targeting the origination point of that ED, which in this case comes in at the 3922 level. While we do technically have enough waves in place to consider the purple count completed on the ED chart we still have a bit or work to do to confirm that we have indeed struck a bottom and in fact, at the time of this writing we are testing a very key price resistance level that should give us the first indication as to whether that bottom has indeed already been struck.
Purple Count
WIth today's action we certainly have enough waves in place to consider the purple wave (b) completed into the lows and the strong move up off of the lows is certainly a decent start to a bottom here. We are however now testing the 100ext of the initial move up off of the lows at the 3796 level on the ES. If we can see a sustained break of this level then we will have the initial confirmation that we may have formed a bottom under this purple count. From there we should see a break back over the 3836 level which then should have us targeting the 3922 level in fairly short order as this was the origination point of the ED. If we are unable to breakout over the 3796 level and follow that u with a move over the 3836 level but rather fail and then move back under the 3750 level then we likely still need another lower low to finish off the wave c of (v) of v of (b). down towards the 3701-3674 region.
Red Count
As noted above the red count is much less likely with this action and it would take a very ill-proportioned series of nested 1-2s to the downside to make this path viable which I am not seeing as highly probable at this point in time. I will however leave the count on the charts for now as long as we are able to hold under the 3877 level on the ES which would be the official invalidation point but again I am not viewing this as highly probable at this point in time.
Green Count
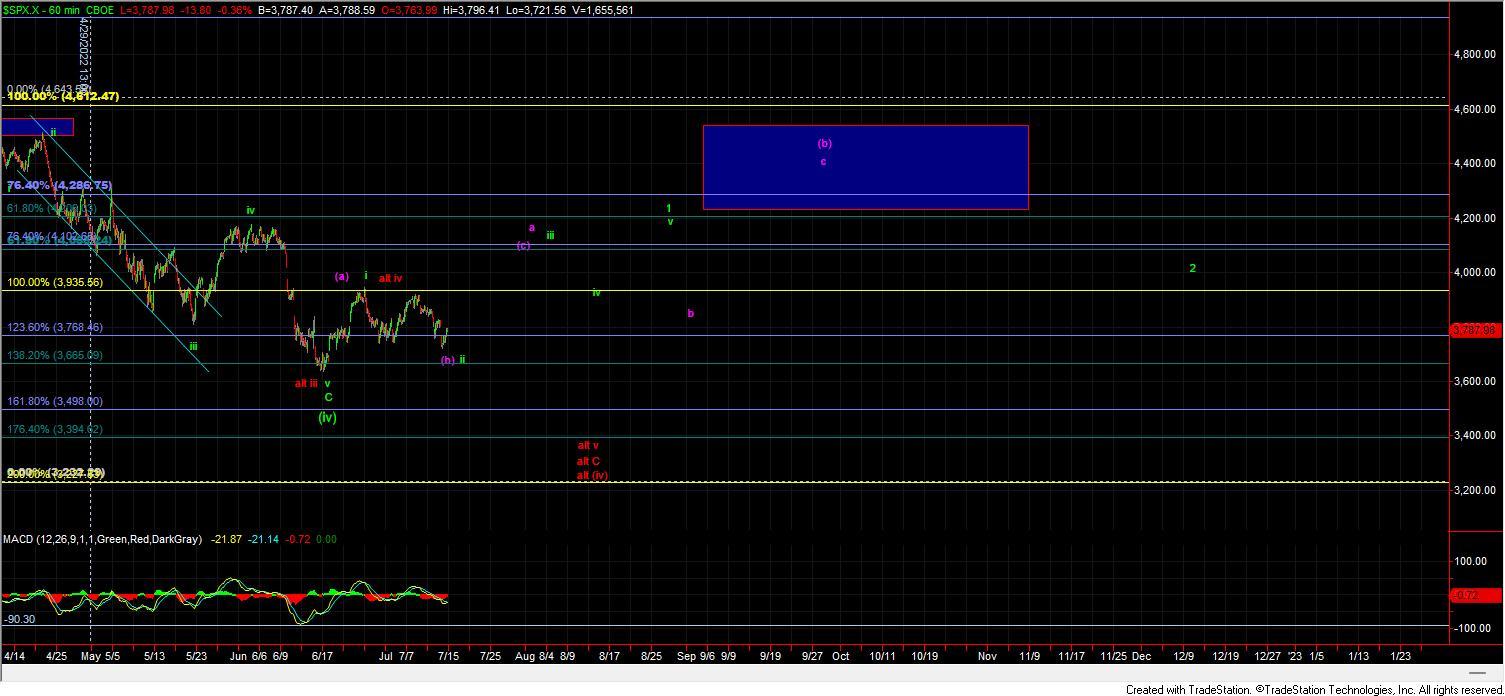
I have added the green count to the 60min chart which would suggest that we are seeing a 1-2 up in leading diagonal form. This path would start out very similar to the purple count but would begin to morph as we get deeper into the count. I am hesitant to project this count too early in the pattern but as we have now invalidated the yellow count I will add this count to the 60min chart and keep an eye on it as we progress higher.
I am viewing today's action as progress from what we have been seeing over the past week as we have now eliminated one of the possible paths and made the red count much less likey. So although the action is still quite sloppy I can now say that the purple count is by far and away my primary count. Whether we have bottomed already or not is not terribly relevant, and the 3796 level should be quite key in telling us whether a bottom has indeed been struck, but even if we do see another lower low we should be quite close and the reversal from that next low should be quite swift back to the upside.