One Lump Or Two
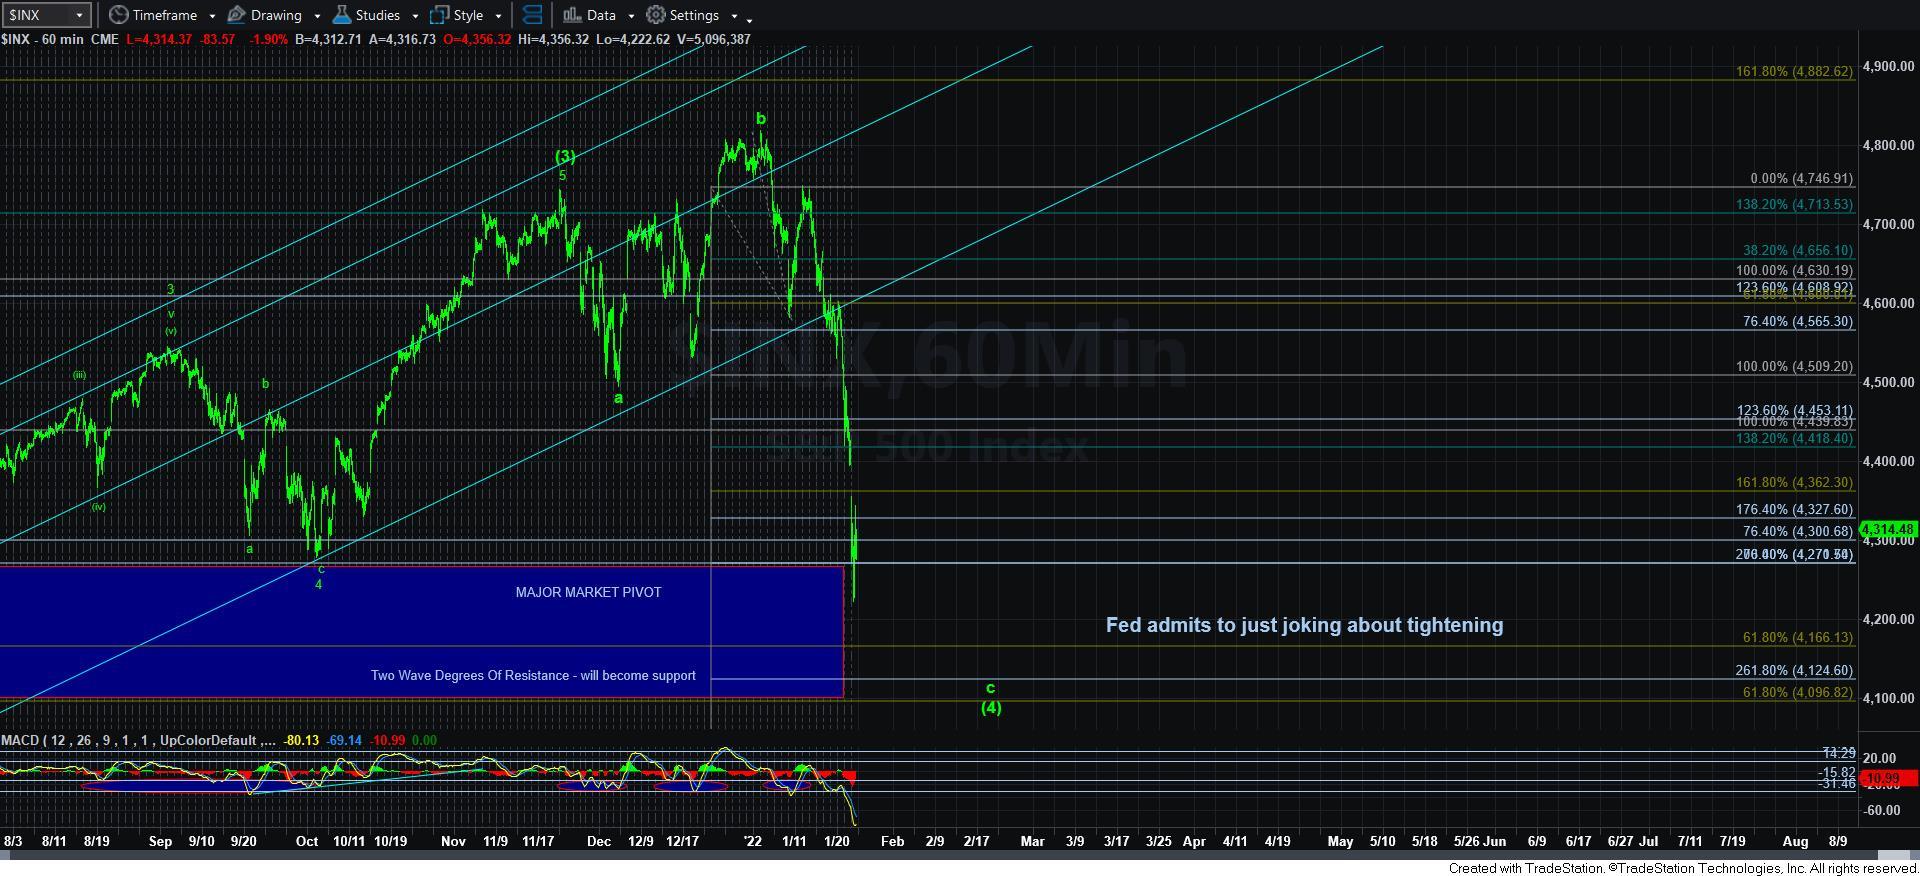
With the market continuing to extend lower today, I think it made it quite obvious that it needed to test our Major Market Pivot.
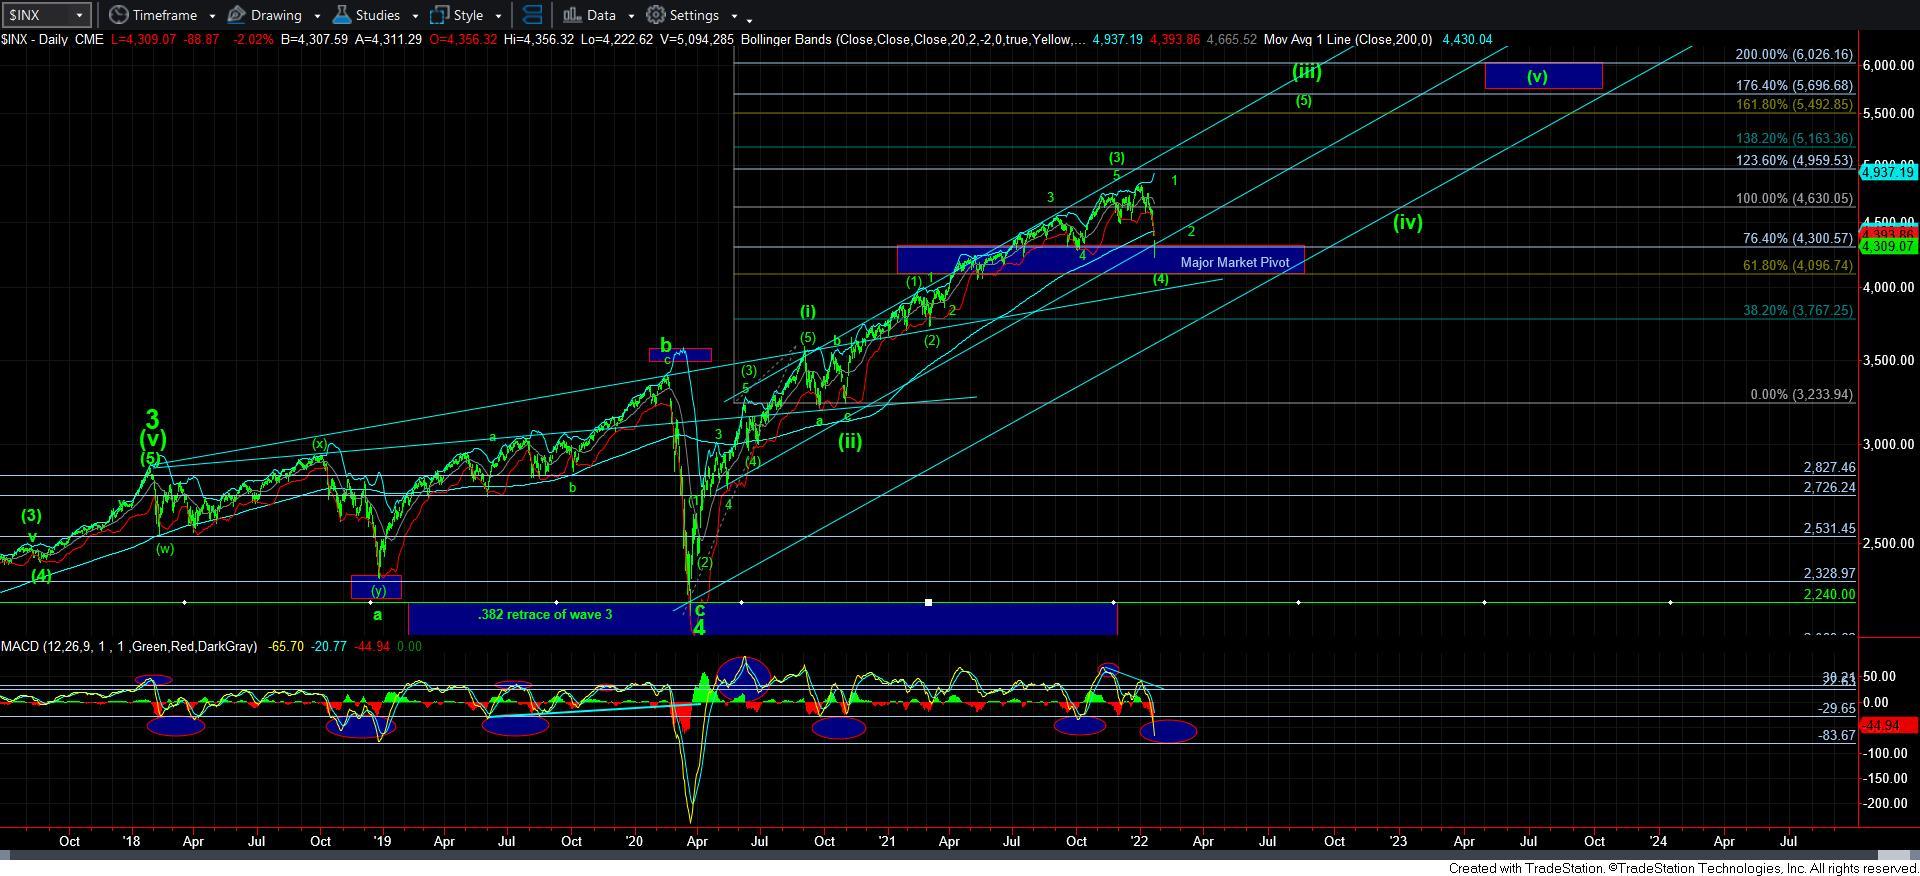
Just to remind you again, based upon our Fibonacci Pinball, wave [3] of [iii] will often target the 1.00-1.236 extensions of waves [i] and [ii], as you can see on the daily SPX chart. That is the exactly where the market topped. And, from that point, we often pullback to the .618-764 extension of waves [i] and [ii], which is the 4096-4300SPX region. That seems to be what the market is intending at this point in time.
Again, please take note at how oversold the daily MACD is sitting this afternoon. The other time we came down this low, we saw a 1000+ point rally, which was back in 2019. And, this is the deepest we have been oversold since the March 2020 low. In fact, there are some charts that are even that oversold at this time.
So, the question now is how deep into this support do we drop. And, much depends on how the market resolves this afternoon.
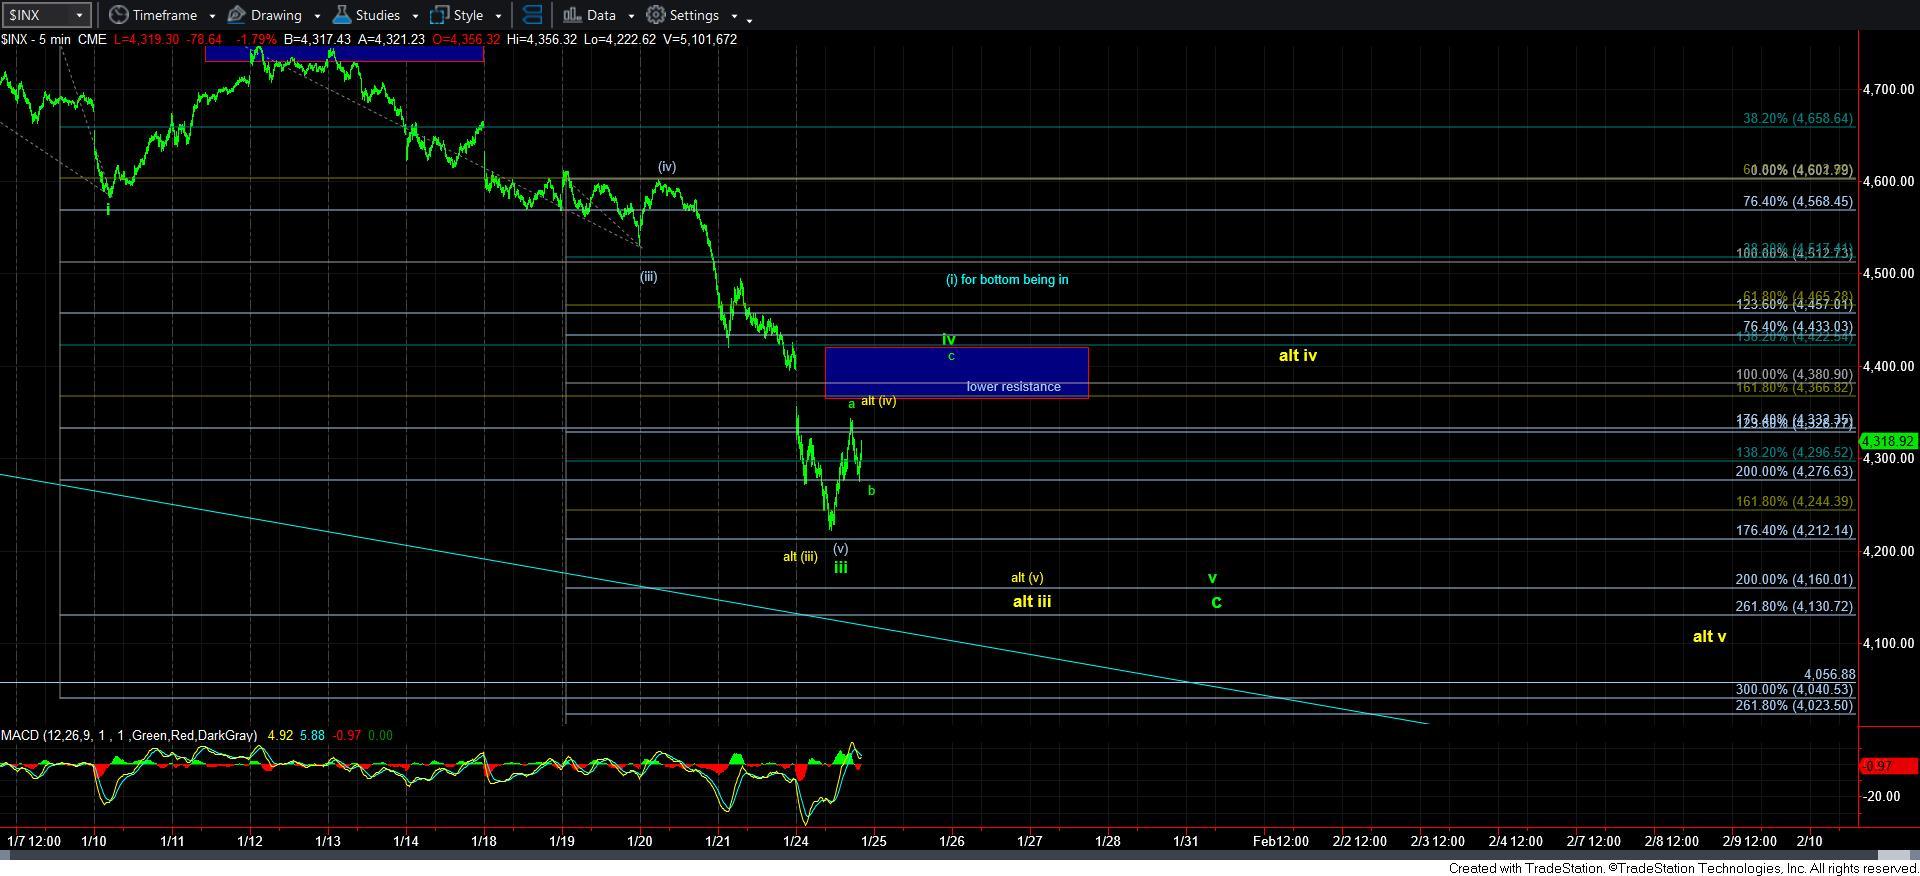
If you look at the 5-minute SPX chart, you will see I am tracking two main counts – green and yellow – which suggest that we need AT LEAST one more lower low before a bottom is struck to this c-wave of [4]. The yellow count would take us lower as long as we remain below today’s afternoon rally high, and then provide us with a wave iv bounce, to be likely followed by a lower low at the bottom of our pivot.
However, if the market is able to exceed today’s rally high before breaking back below today’s low, then the most I can foresee is one more lower low as presented in green.
Lastly, should the market break out directly higher into tomorrow, and take us through the 4440SPX region directly, then that would be an indication that wave [4] is done, and we are completing wave [i] of 1 of wave [5] of [iii]. As you can see on the daily chart, I would expect the wave 1 of [5] of [iii] to take us back to the prior highs – followed by a sizeable wave 2 pullback – which would then project right to our 5500SPX target to complete all of wave [iii].
So, the bounce today is suggesting that the market is slowing its descent, and that the strongest segment of the decline is likely done. At this point in time, we are likely going to be dealing with what they call “backing-and-filling,” as we complete various 4th and 5th waves, depending upon how the market resolves in this region in the coming day or so.
Now, I am going to apologize to all those that have continually asked me “what if” questions. I am sorry, but I really do not have time for all these “what if” questions. I would much rather be dealing with “what is,” especially during a fast market. And, our “what is” analysis is that we have a strong area of support in the market for wave [4]. And, that the market is working in ABSOLUTELY typical fashion for this degree of wave [4] of [iii]. While wave [3] came up a bit short our ideal target, it is clear that wave [4] was going to break down below the 4440SPX region since that was only a target if we had gotten to our ideal target of 4882+.
For now, we are simply going to track this bottoming structure over the coming days. And, for those that raised cash as per my suggestion, this is a good time to look to deploy that cash in a layered fashion. As I always note that I begin buying positions where I think wave iii of the c-wave is nearing conclusion, I did some purchasing today, and added some more IWM positions to my holdings (not options).
Remember, we have maybe 200 or so points of risk in here (assuming we do drop all the way down to the bottom of the pivot), with 1200 points of upside potential for our 5500SPX target for wave [5] of [iii]. Consider your risk reward in this region and please also make sure you maintain your risk management perspective as well. While this pattern is certainly well within the parameters we see in bull markets, I can always be wrong. But, for now, I have no reason to believe this is anything but a standard wave [4] pullback within wave [iii] of a 5-wave structure off the March 2020 low.