Now What? - Market Analysis for Nov 19th, 2026
 By
Avi Gilburt
Well, as I outlined earlier today, the green count we were tracking has finally invalidated. Does that mean the market cannot take us to higher highs? No, that is not what it means. Remember, the fact that we did not see the typical reaction when a diagonal completed keeps the door open for some time that the market can rally one more time to higher highs. But, what it means is that we currently have no more set ups that are pointing to higher highs. Of course, one can always develop.
So, I must warn you. Since I cannot be sure that a major top has been struck due to the lack of expected reaction, I am going to keep that door open. And, IF . . big IF right now . . I see a CLEAR 5-wave rally off a low in something larger than a micro count or an expected c-wave rally, I may have to again present a wave count for a higher high. Also, there are still a number of individual equity stocks that have potential bullish set ups at this time. Therefore, consider this a forewarning which I will likely repeat many times in the future.
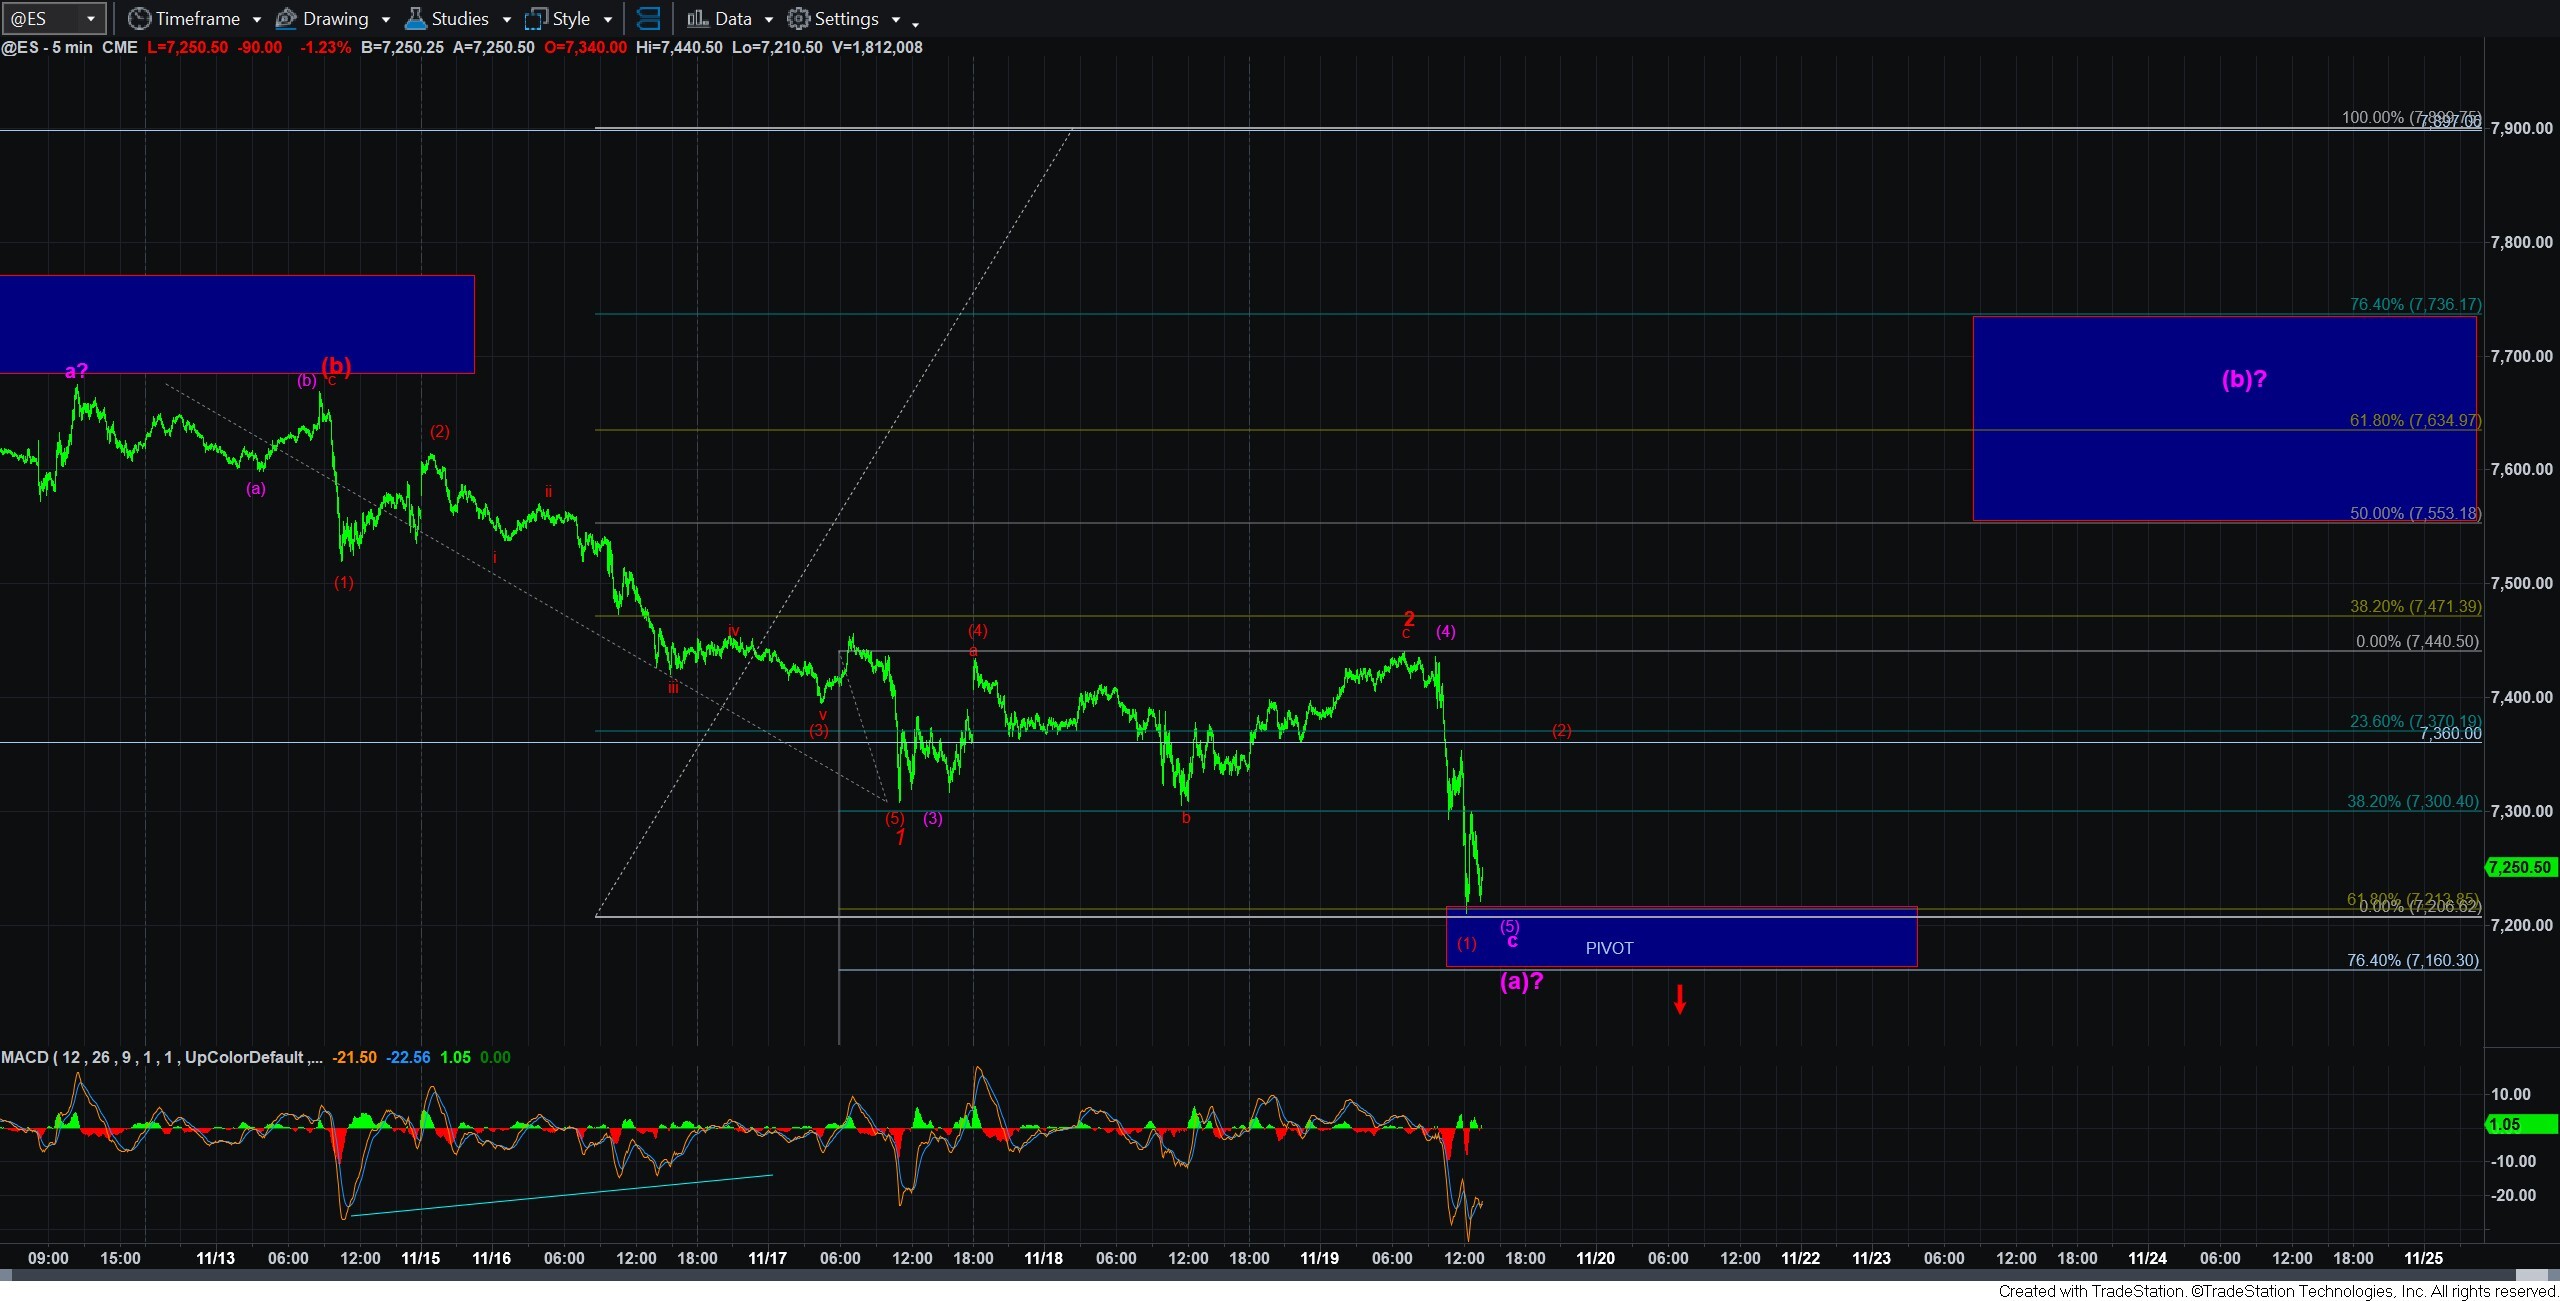
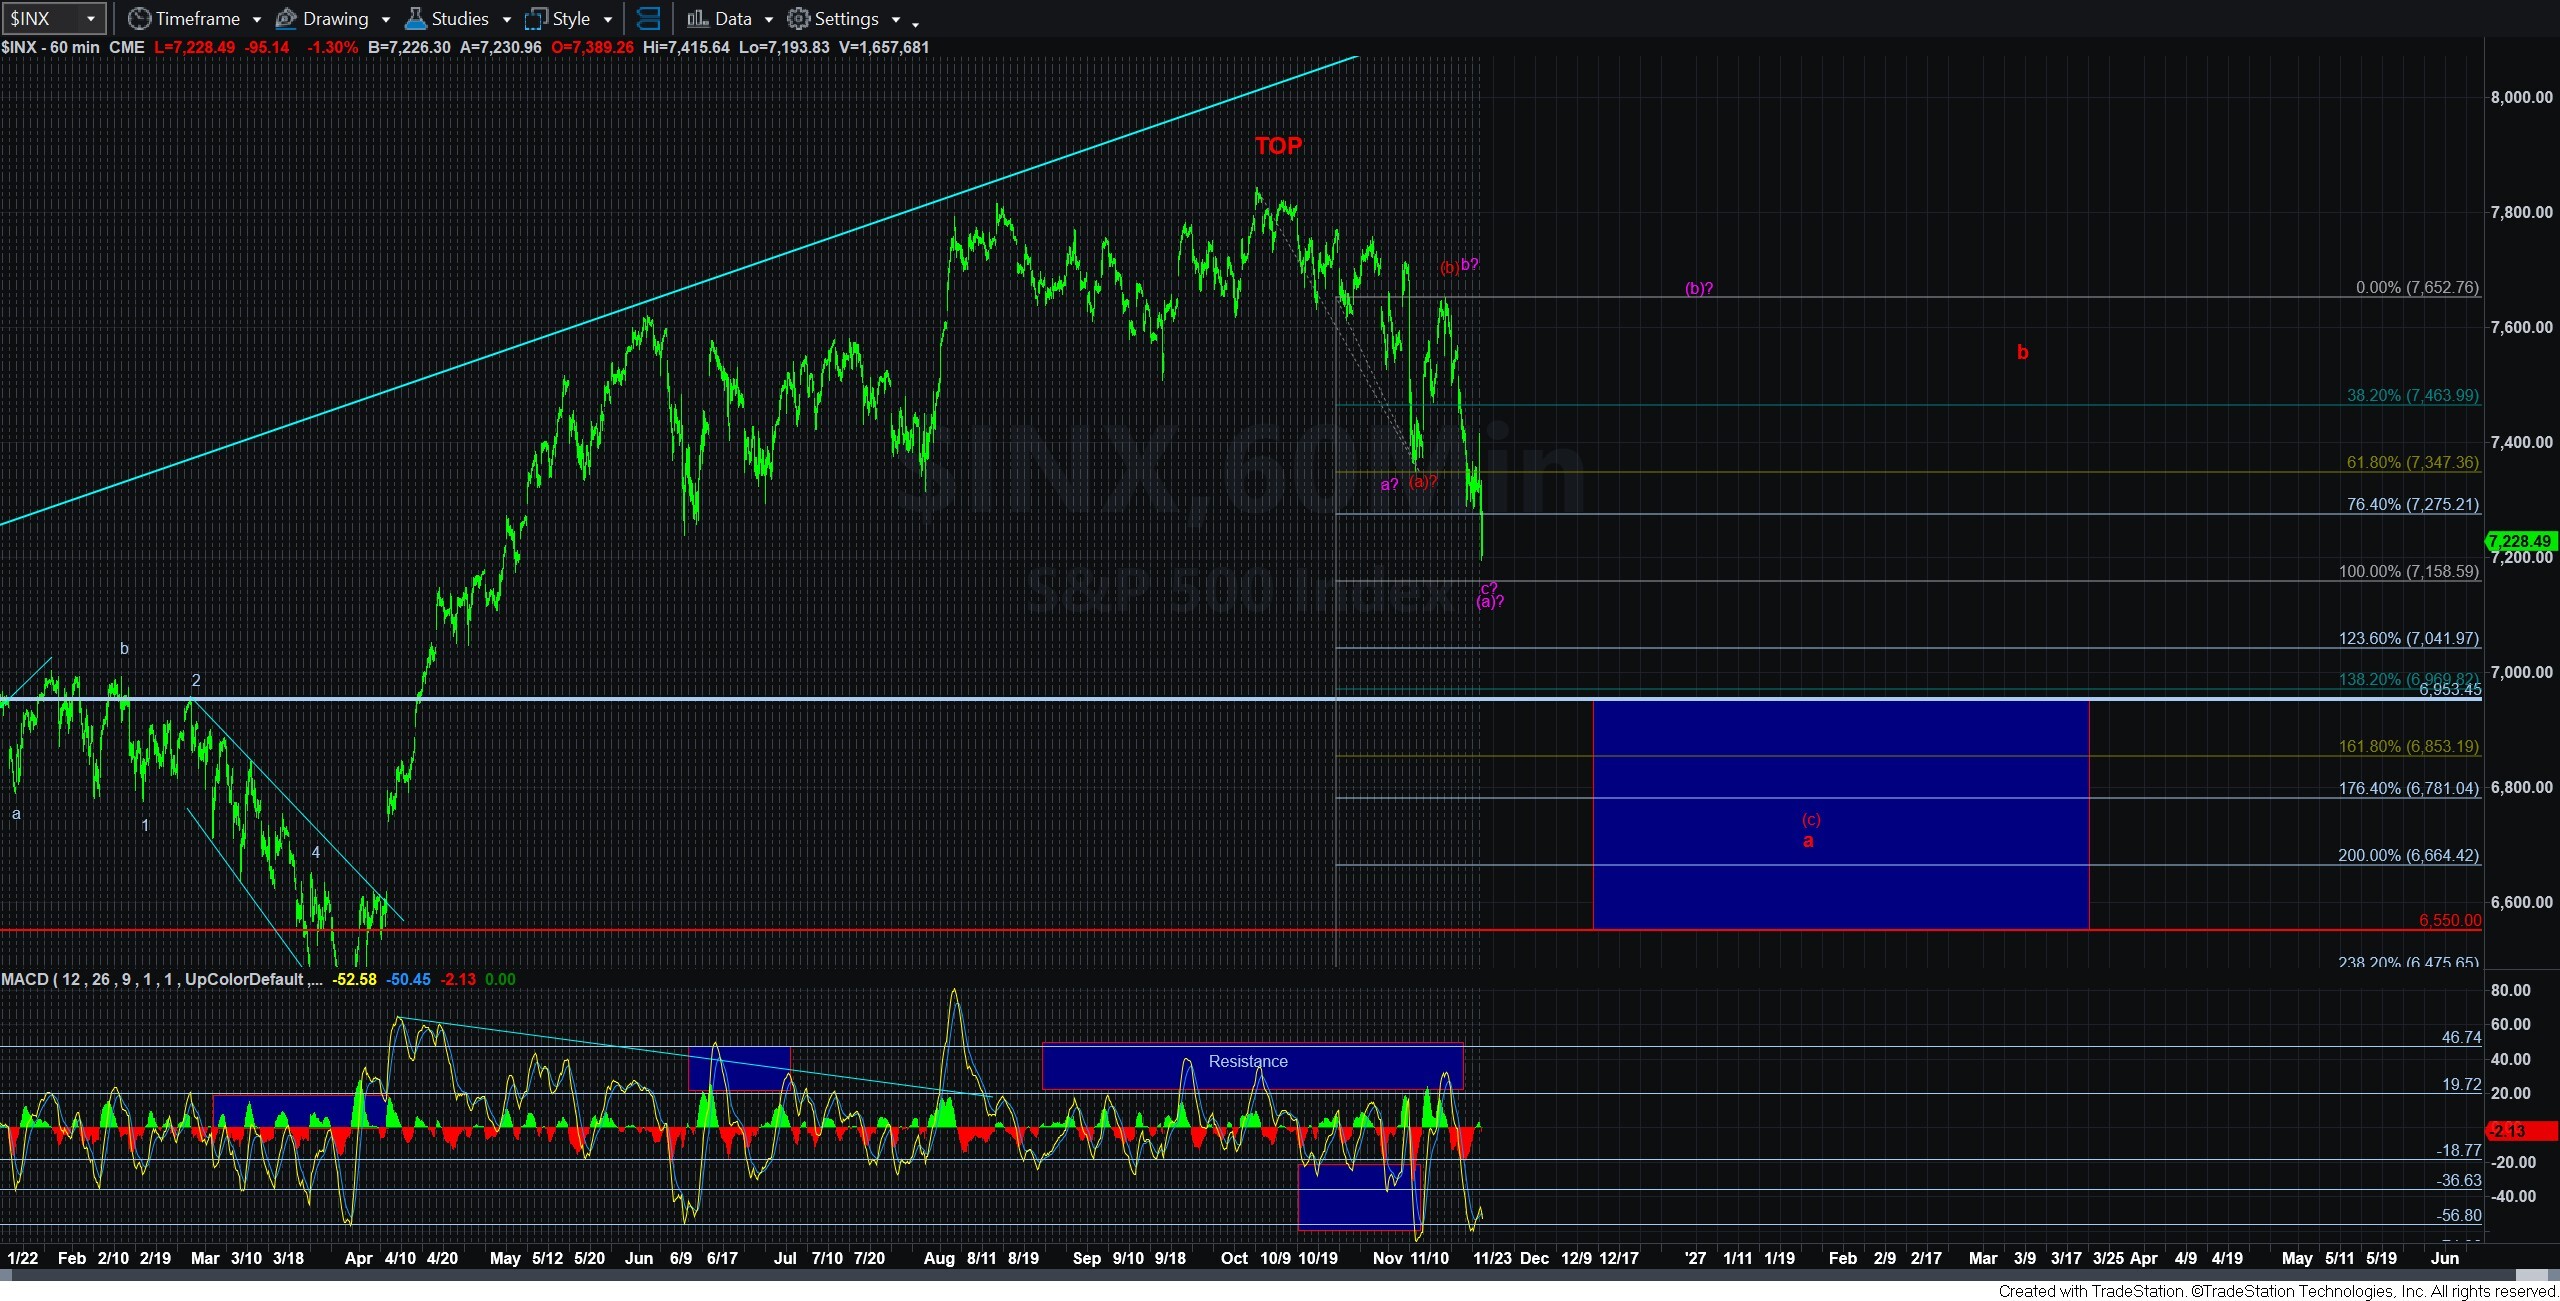
For now, I am not going to be presenting any bullish alternatives unless I see a CLEAR 5-wave rally in the SPX. So, as long as all bounces remain corrective, I am going to keep analyzing the action as presenting us a path to the next lower box on the 60-minute SPX chart. And both the primary and alternative counts are going to be pointing us lower.
I have noted in many past updates through the years that the initial move down off a high – assuming it is a corrective structure – often makes it difficult in assessing where the first larger degree a-wave completes. And, this structure off the early October high is no different.
So, for now, I am only presenting bearish paths lower for a bigger a-wave decline. The first is more aggressive, which we have been tracking these last few days. That represents a 1-2 structure in a bigger (c) wave decline. But, as long as the support box on the ES chart holds as support, I can also maintain a reasonable alternative which is also presented in purple.
However, I must warn you again that breaking the pivot, along with the 7158SPX (a)=(c) level, opens the trap door down to the 6700 region. Yes, that is to where a 2.00 extension of the 1-2 as presented in red is pointing us. And, that is a standard target for a 1-2 structure. Of course, once we begin breaking support (which has held for quite some time in this bullish market) we can always see acceleration that takes us well below it and to the bottom of our next target box below. But, for now, I am simply going to keep it as a standard expectation of the 6700 region should we break down below the pivot support on the ES chart.
But, if you are looking to short “in the hole” as they call it, I must warn you that there is still a reasonable perspective for a bigger (b) wave bounce in purple. So, you may want to be a bit more cautious if you are attempting to trade the 1-2 downside count aggressively before a break of that pivot support. Once that pivot support breaks, then it will become our resistance for the direct path lower. This is typical Fibonacci Pinball.
In summary, with the break of the bullish potential count, and until another rears its head, all counts will be pointing lower for the foreseeable future. And for now, we have a lower box target on the 60-minute SPX chart, with two paths to take us there.