Nothing Fits Well Right Now
As I said on my live video this morning, when I do analysis, I not only search for what may be the most probable wave count in the smaller degree structure I am analyzing, I also have to make sure how it fits in the next higher wave degree. Right now, I do not have anything that is fitting on two waves degrees.
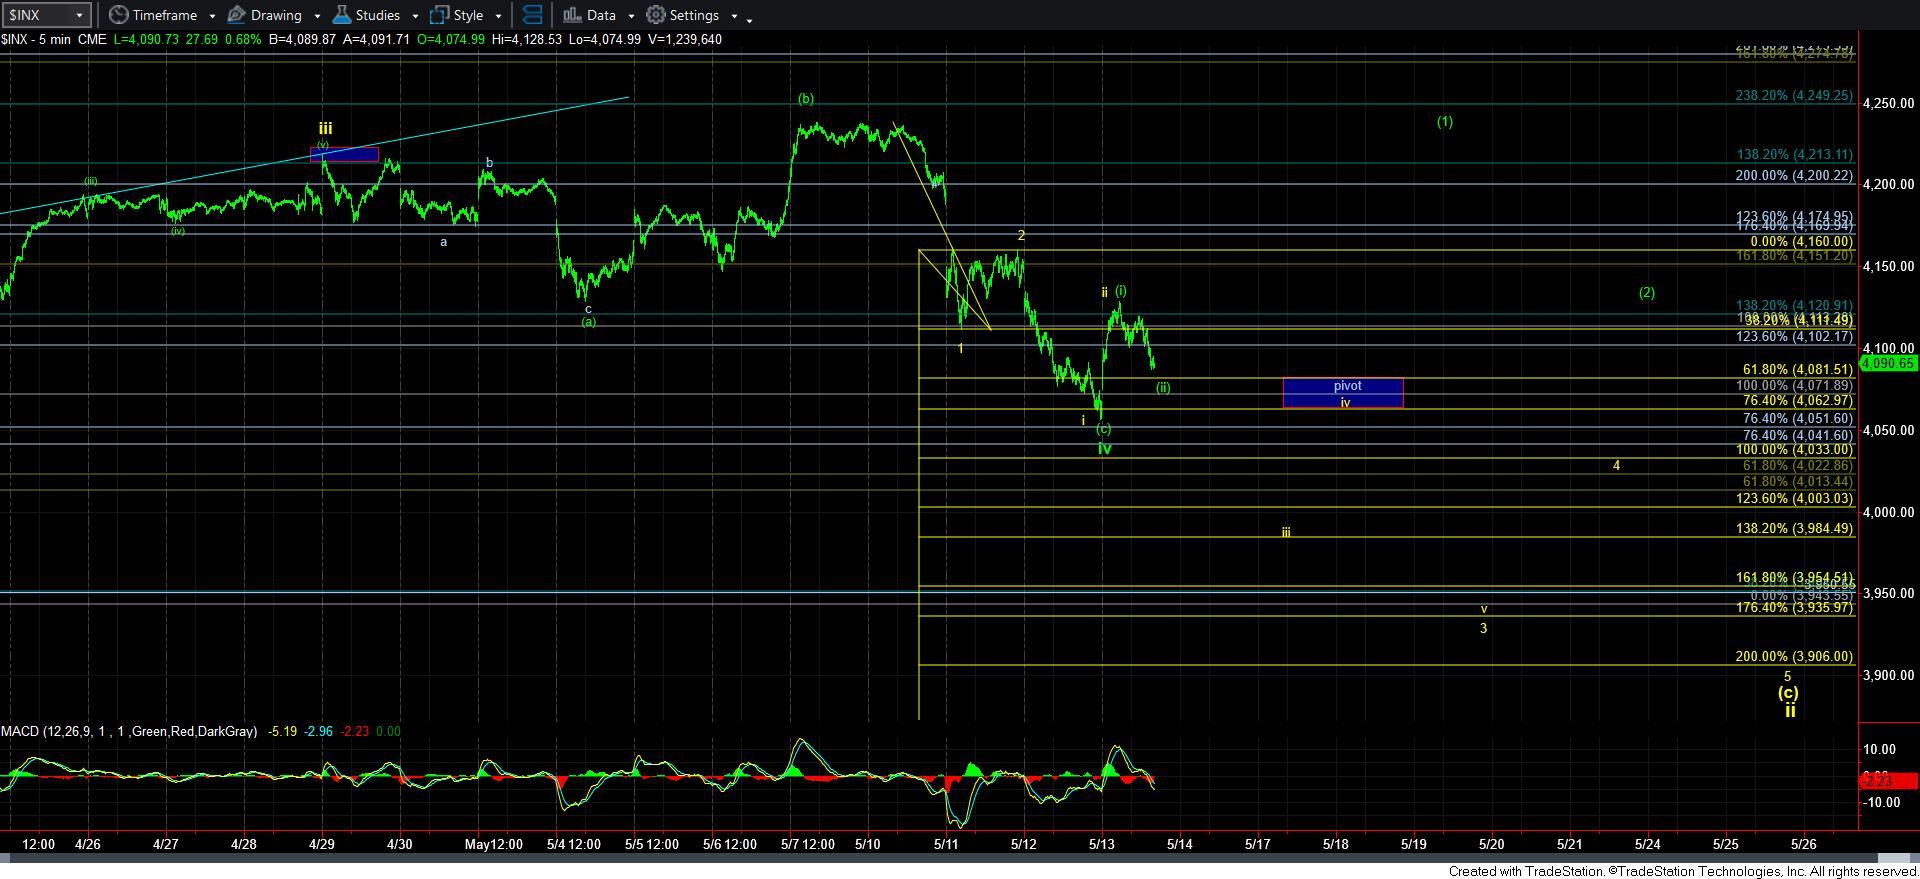
With the market rallying off yesterday’s SPX low, and through the market pivot, I am left with two potential paths, and neither are at all ideal, which is what has caused confusion in my smaller degree wave structures.
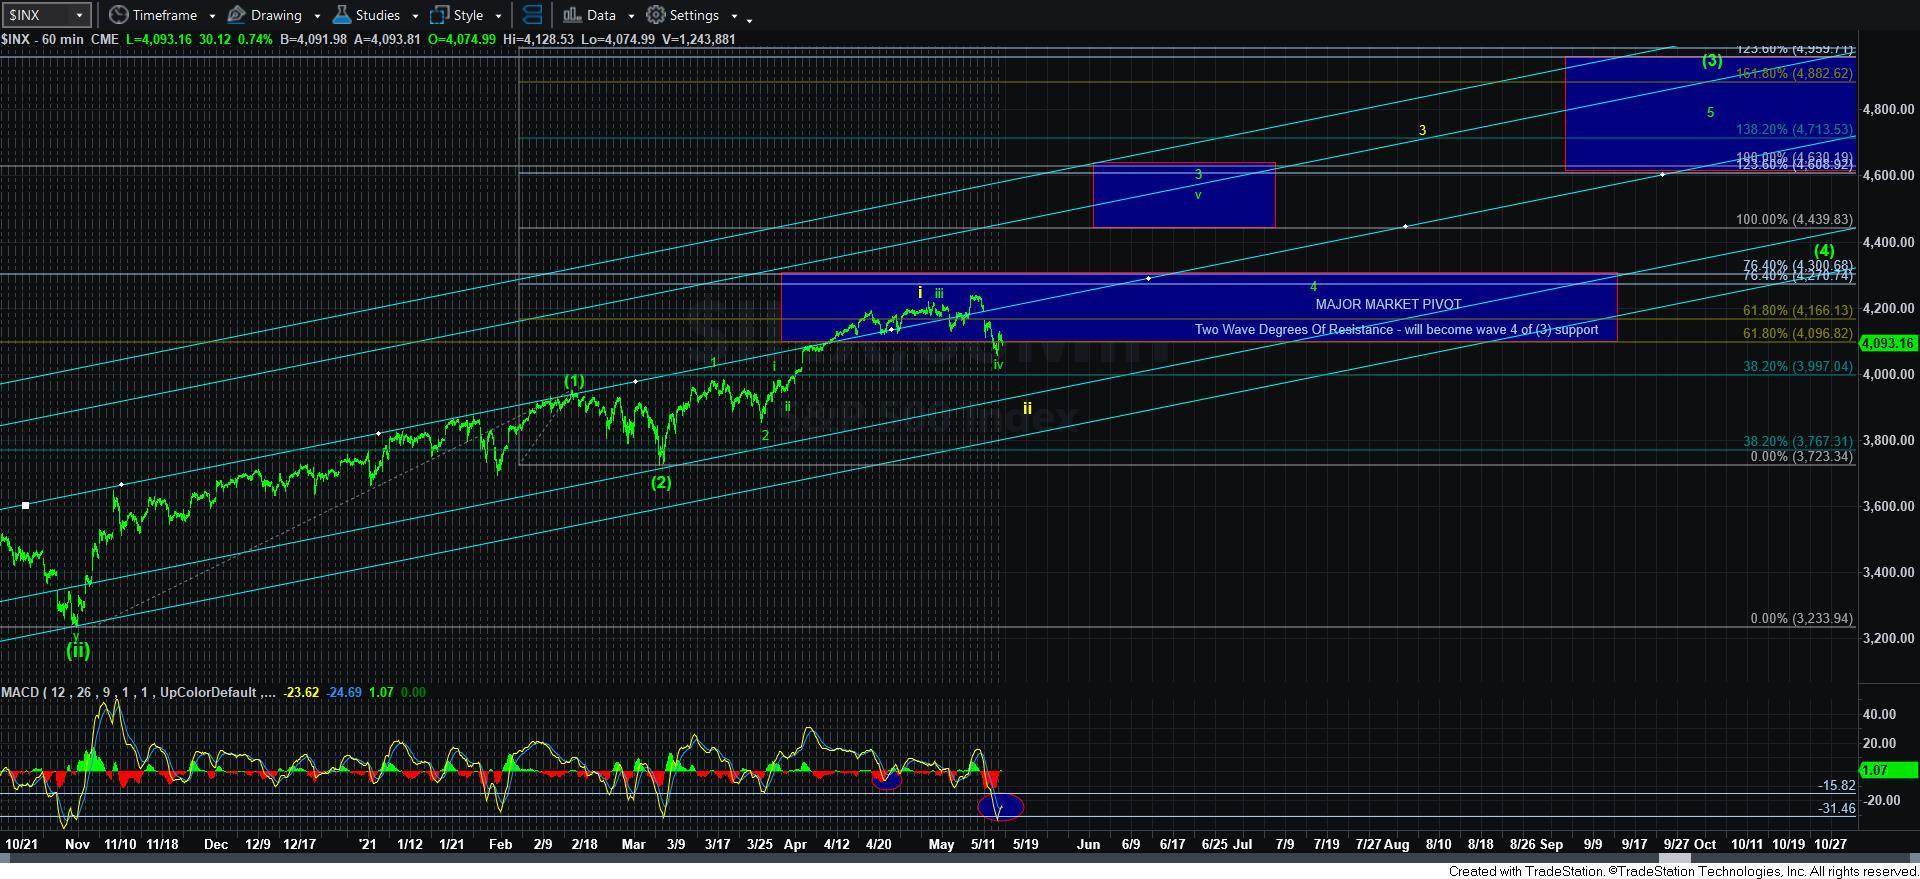
In the bullish case, we have a very deep wave iv, which would have completed yesterday. But, the rally off the low does not count well as a 5-wave completed structure in the futures, and the SPX pattern is a bit questionable as well as a 5-wave structure. Moreover, in order to complete a bigger 5-wave structure for wave 3 of [3] on the 60-minute SPX chart, we would have to rally back to the all time highs in 5 waves to complete wave [1] of 3. While that would be a relatively reasonable expectation, it would project wave 3 beyond our 4440SPX ideal target. Yet, this would seem more reasonable than the alternative.
In the bearish case scenario, we have a i-ii downside structure in place for wave 3, which projects a bit lower than the 3900SPX region for the bigger yellow wave ii.
When we add in the fact about how oversold the markets were yesterday (we have to go back to October 2020 to see the 60-minute MACD more oversold than where we were yesterday), I have to side with the green bullish count as long as we remain over yesterday’s low in the SPX.
But, please recognize that the yellow count does not invalidate until we are able to break back out over 4160SPX. If we can build more of a bullish structure through 4160SPX, then I would feel much more comfortable with the more immediate bullish case. In the meantime, I still have issues considering the yellow count due to the oversold nature of the market along with the potential for it to project a bit below 3900SPX. So, while the weight of evidence seems to be leaning towards the more immediate green bullish count, I would feel much more comfortable if we can move over 4160SPX.
So, in summary, a break back over 4160SPX makes us much more near term bullish. We would then likely be completing wave [1] of wave 3 near the all-time highs, followed by a wave [2] pullback, which would likely set up an inverted heads and shoulders pattern, with our Elliott Wave projections targeting at least 4400SPX, and potentially north of 4500SPX.
However, if the market should break below yesterdays low in the SPX, then I have to lean our probabilities towards the 3900SPX in the coming weeks.
Unfortunately, both patterns have issues, so many of you may want to allow the market to clear up a bit more before you get back engaged in a more aggressive fashion.