Not What Most Expected
As we came into today’s CPI announcement, many Wall Street mavens, JPMorgan amongst them, were calling for a 5% mini-crash if the CPI came in hotter than expected. And, as I write this update, we are now 2.5% positive.
I have written about this many times in the past, and I am going to take the opportunity to highlight this point again. While the substance of a news event can catalyze a market move, the substance of the news event is not going to always be indicative of the direction of the ultimate market move.
In August 1998, the Atlanta Journal-Constitution published an article by Tom Walker, who conducted his own study of 42 years’ worth of “surprise” news events and the stock market’s corresponding reactions. His conclusion, which will be surprising to most, was that it was exceptionally difficult to identify a connection between market trading and dramatic surprise news. Based upon Walker's study and conclusions, even if you had the news beforehand, you would still not be able to determine the direction of the market only based upon such news
And, I think today provided us with yet another good example. May I also remind you what Robert Prechter has noted about this type of market move based upon a news event:
“Observers’ job, as they see it, is simply to identify which external events caused whatever price changes occur. When news seems to coincide sensibly with market movement, they presume a causal relationship. When news doesn’t fit, they attempt to devise a cause-and-effect structure to make it fit. When they cannot even devise a plausible way to twist the news into justifying market action, they chalk up the market moves to “psychology,” which means that, despite a plethora of news and numerous inventive ways to interpret it, their imaginations aren’t prodigious enough to concoct a credible causal story.
Most of the time it is easy for observers to believe in news causality. Financial markets fluctuate constantly, and news comes out constantly, and sometimes the two elements coincide well enough to reinforce commentators’ mental bias towards mechanical cause and effect. When news and the market fail to coincide, they shrug and disregard the inconsistency. Those operating under the mechanics paradigm in finance never seem to see or care that these glaring anomalies exist.” – Bob Prechter. The Socionomic Theory of Finance
I want to also note that the reason I continue to hammer these points home is because I want you to be able to look at the market in an intellectually honest manner, and not to retain blinders on when the market acts in a manner in which you would not expect, and then just move on to the next piece of “news” that you think will move the market – which is why 99% of market participants do. I want you to be an honest and thinking investor.
Last night, I outlined how the market was very stretched to the downside, and I was expecting a reversal in the very near term. And, when the market dropped into the deep red we saw in the futures, I wrote the following alert at 8:56AM:
“This "should" now be the selling climax that completes the downside structure.”
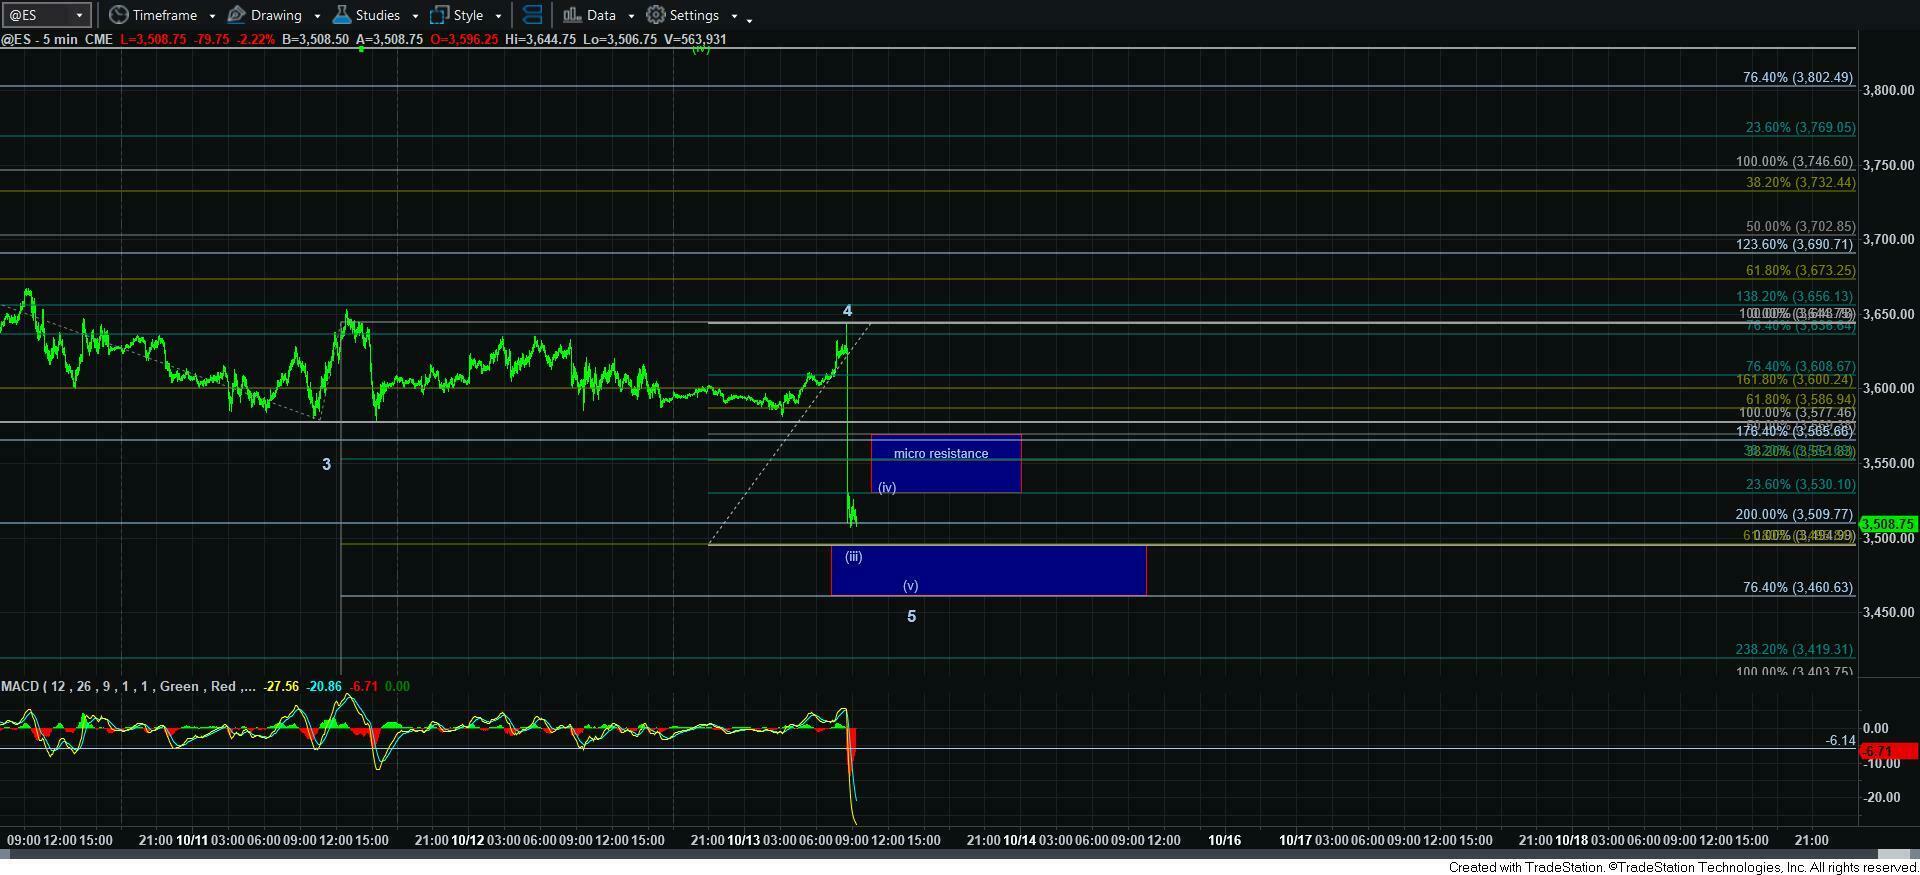
Now, admittedly, I was initially thinking that the lows we were going to strike in the morning was only the wave [iii] of the final 5th wave down, as you can see from the attached chart labeled “Thursday morning,” I noted that I could not really tell if the spike down completed the last 5-wave move, or if we had a [iv][v] left to complete it. So, I said I was simply taking an educated guess that we still see that last [iv][v]. But, the market had other ideas, as it moved through our resistance region, and gave us an initial indication that a meaningful low has potentially been struck.
Yet, we have been in this position before, with last week being an excellent example. Yet, I think this 5-waves up we now have off today’s low seems to be built upon a better bottoming structure. In fact, as I was outlining near the bottom today that we struck a level that represented the wave 5 drop today as being .618 times the size of waves 1-3 off the 3806SPX high we struck last week, which is very common size for a 5th wave.
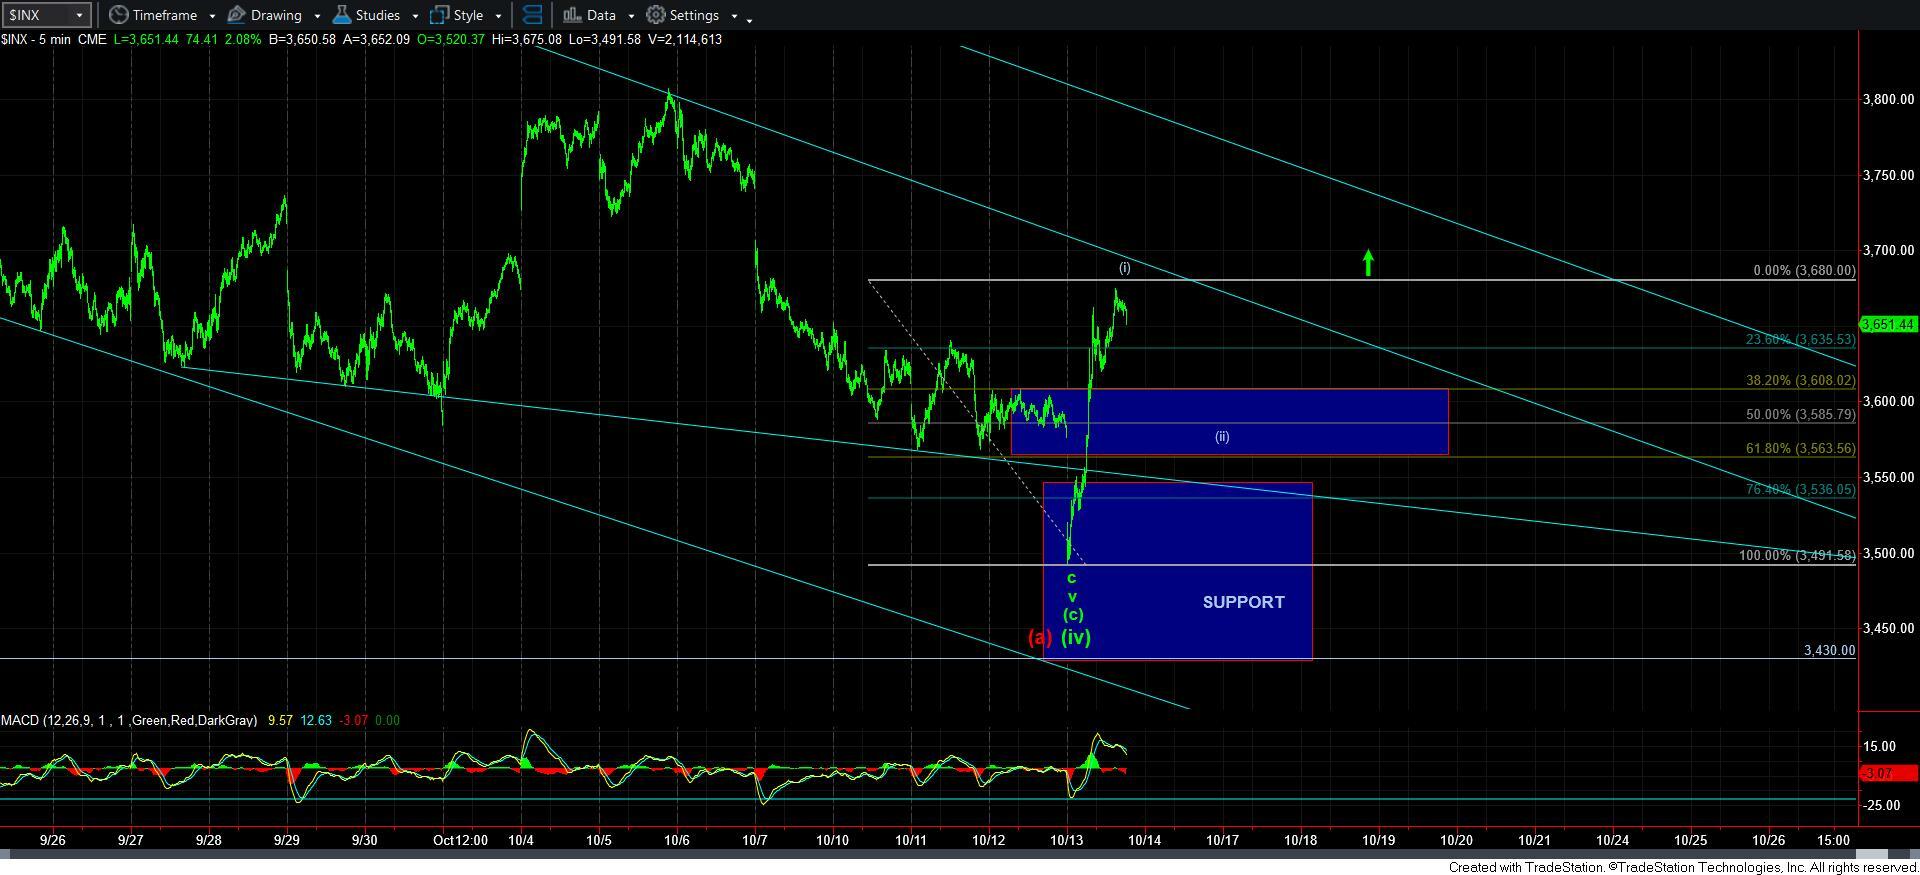
But, you know the drill. I need to now see a clear 3-wave corrective pullback for wave [ii], followed by a rally back over the high of wave [i]. At that point, my ideal target will be the 4150SPX region.
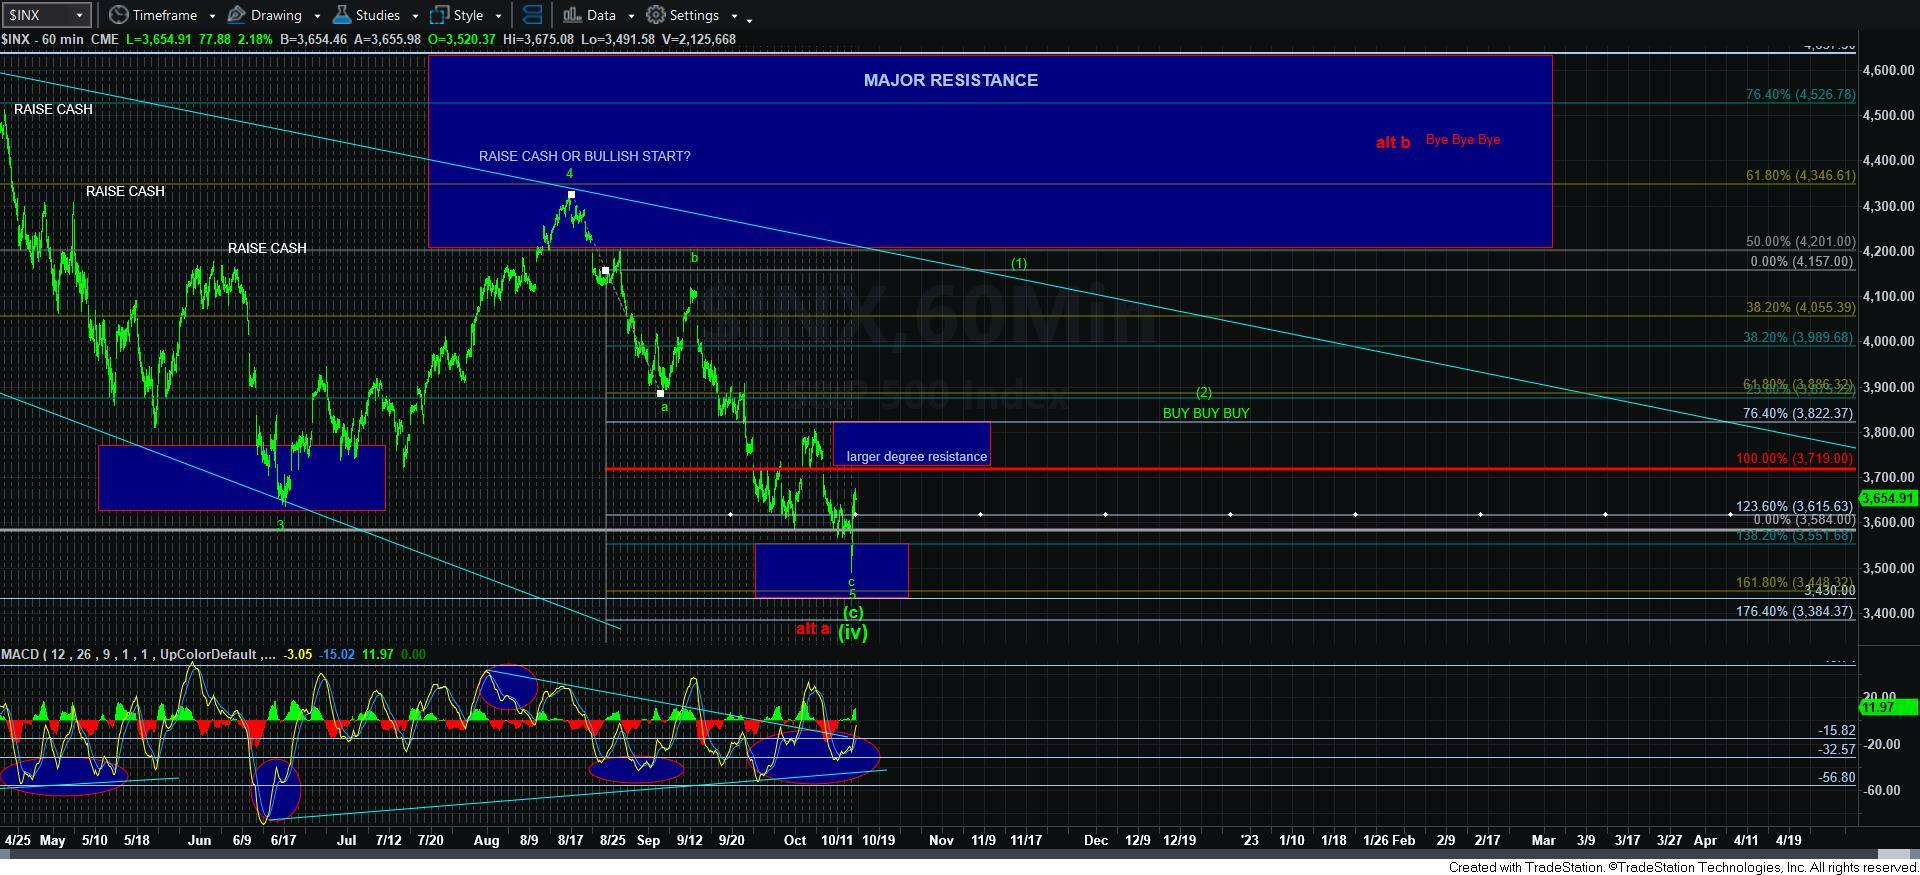
I also want to highlight that the market has certainly put us in a big hole. Therefore, while we have now moved through the micro resistances on our smaller degree charts, please take note of the larger degree resistance that we have between 3720-3822SPX. So, this means that, even though we have seen a relatively solid 5-wave rally off a low within our larger degree support region, with the 5th wave of the 5th wave providing us ideal proportions, we still need the market to prove itself. Again, this means an initial corrective pullback that holds the support box between the .382-.618 retracement region noted on the 5-minute SPX chart, followed by a rally over the potential wave [i] high we strike today. We will then have to contend with the resistance region between 3720-3822SPX, on our way to our ideal target region overhead for wave [1] in green, in the 4150SPX region.
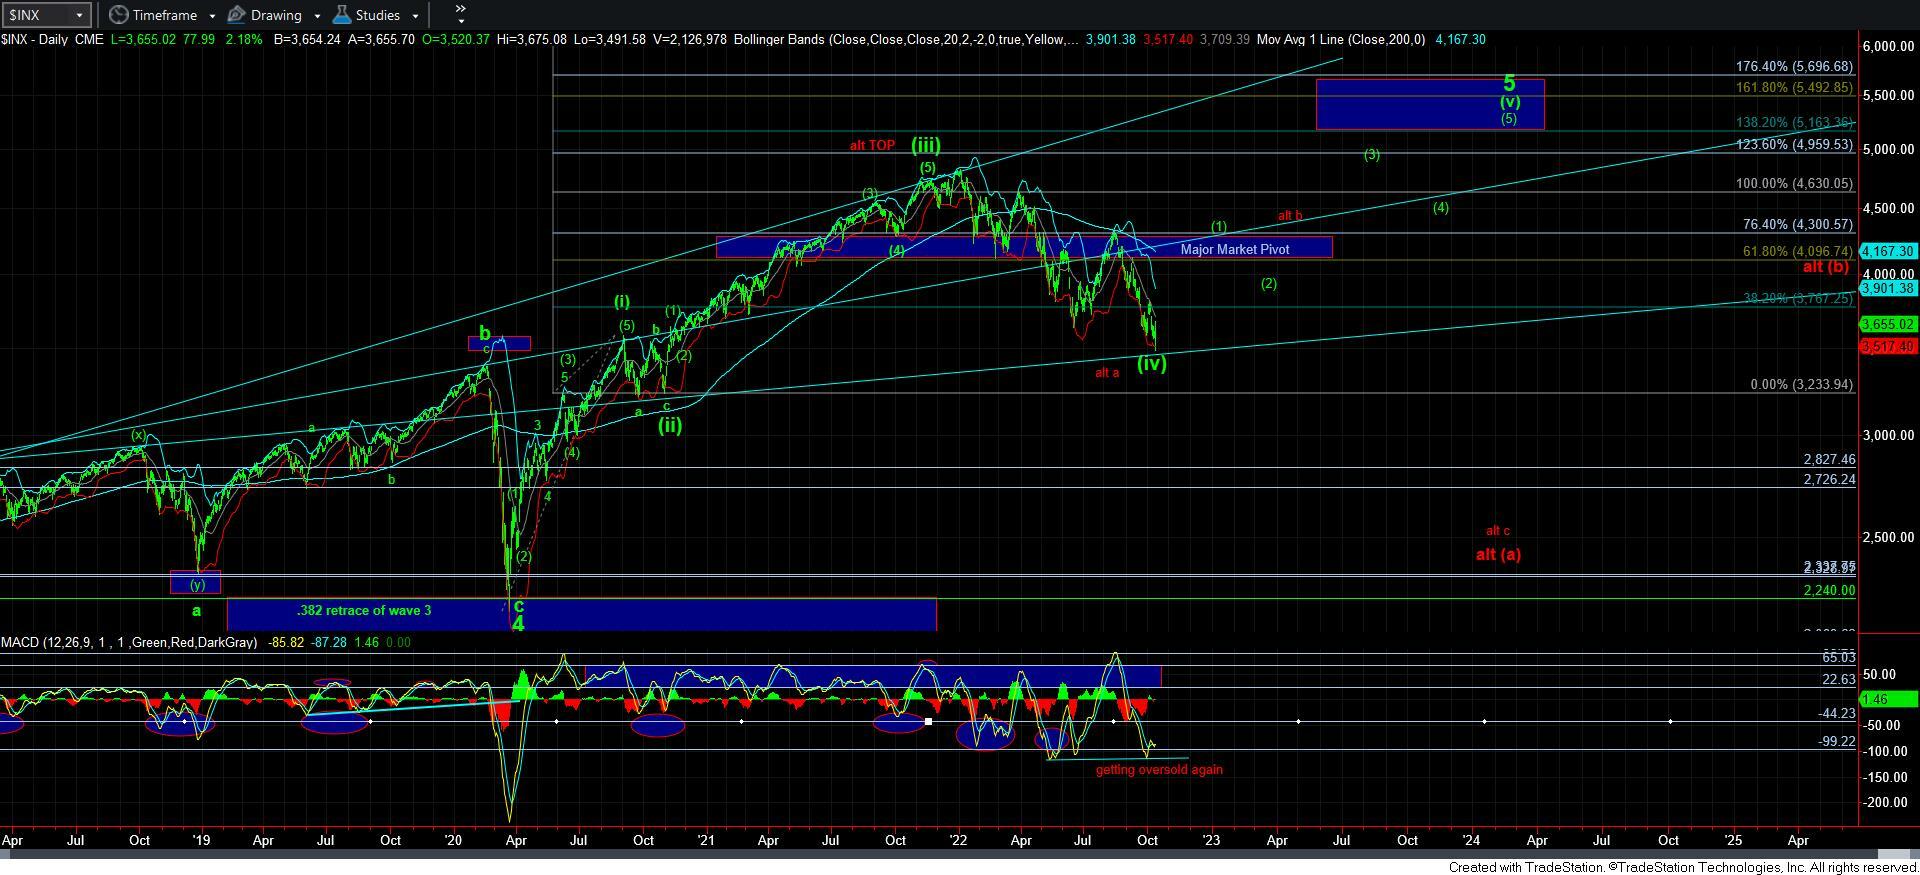
Lastly, take note, once we confirm this potential [i][ii] structure with a break back out over wave [i], the daily MACD has a lot of room to run overhead after providing us some serious divergences down here.