Not Terribly Bullish Action
With the market being unable to retain a strong bullish Fibonacci Pinball structure, it is starting to suggest that this correction has not yet run its course.
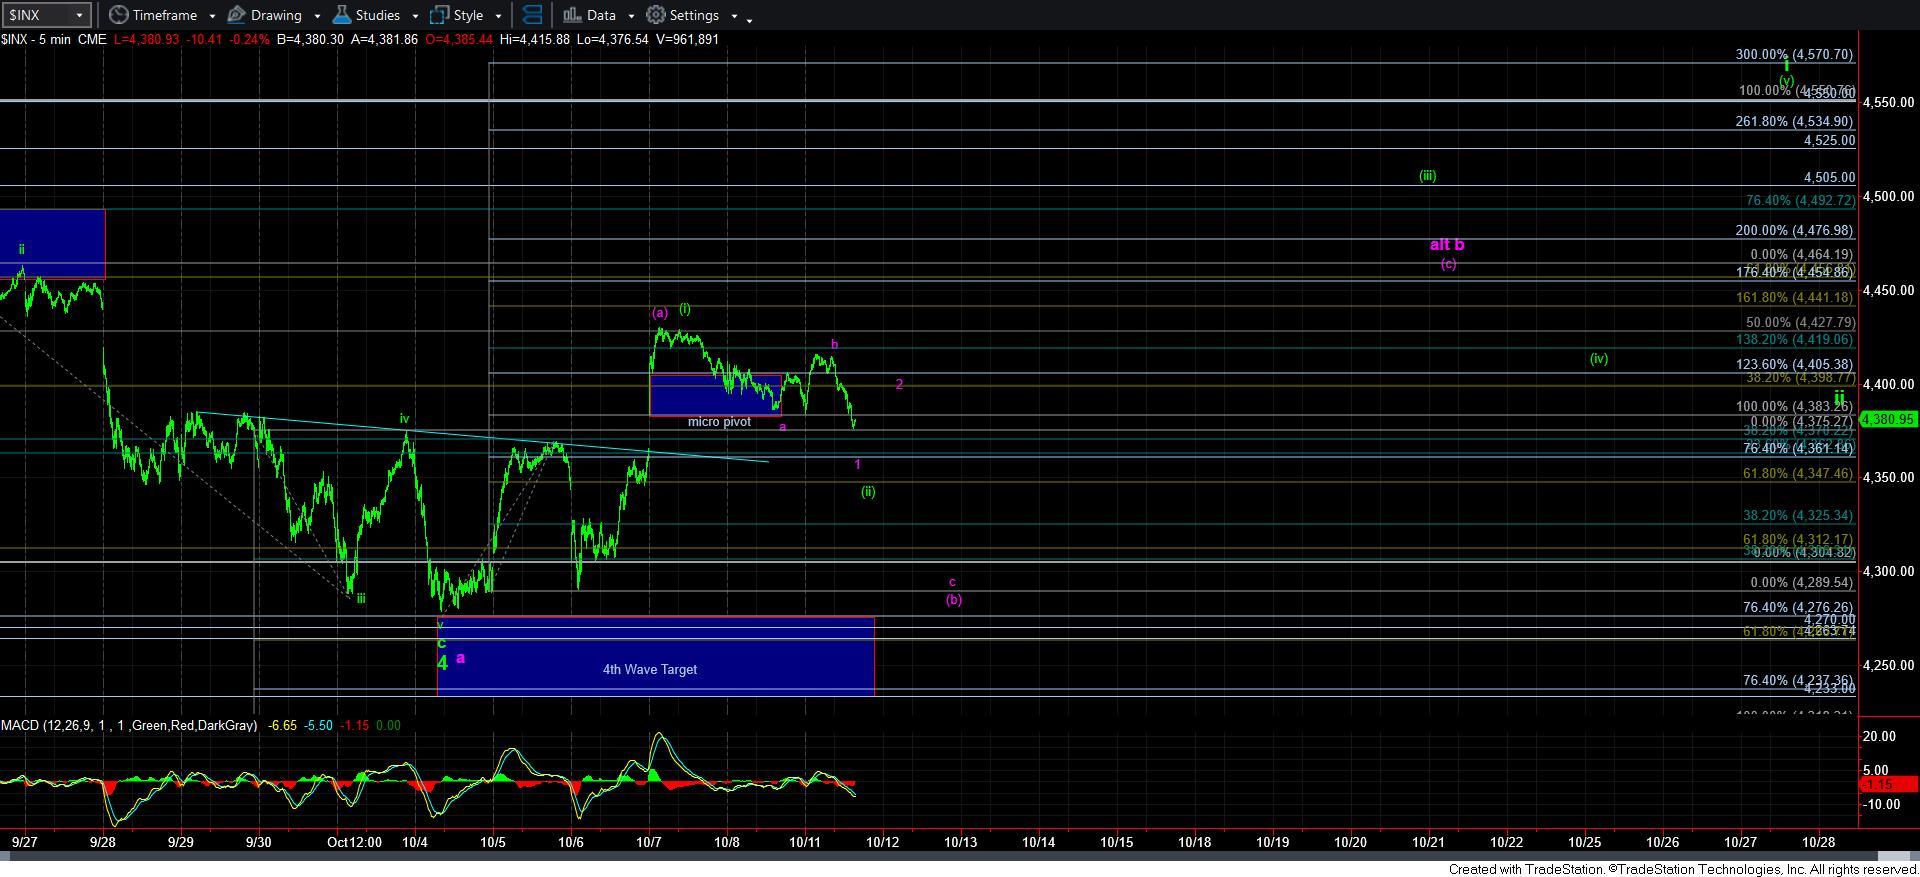
At this point in time, the only potential for the green count to play out is if it is tracing out a leading diagonal, the general path for which is now shown on the 5-minute SPX chart. However, I have zero confidence in that potential until the market actually proves it.
In the meantime, it seems that the market is suggesting that the bottom has indeed not yet been struck in this correction – at least from a higher probability perspective. And, we can take several paths to a lower low.
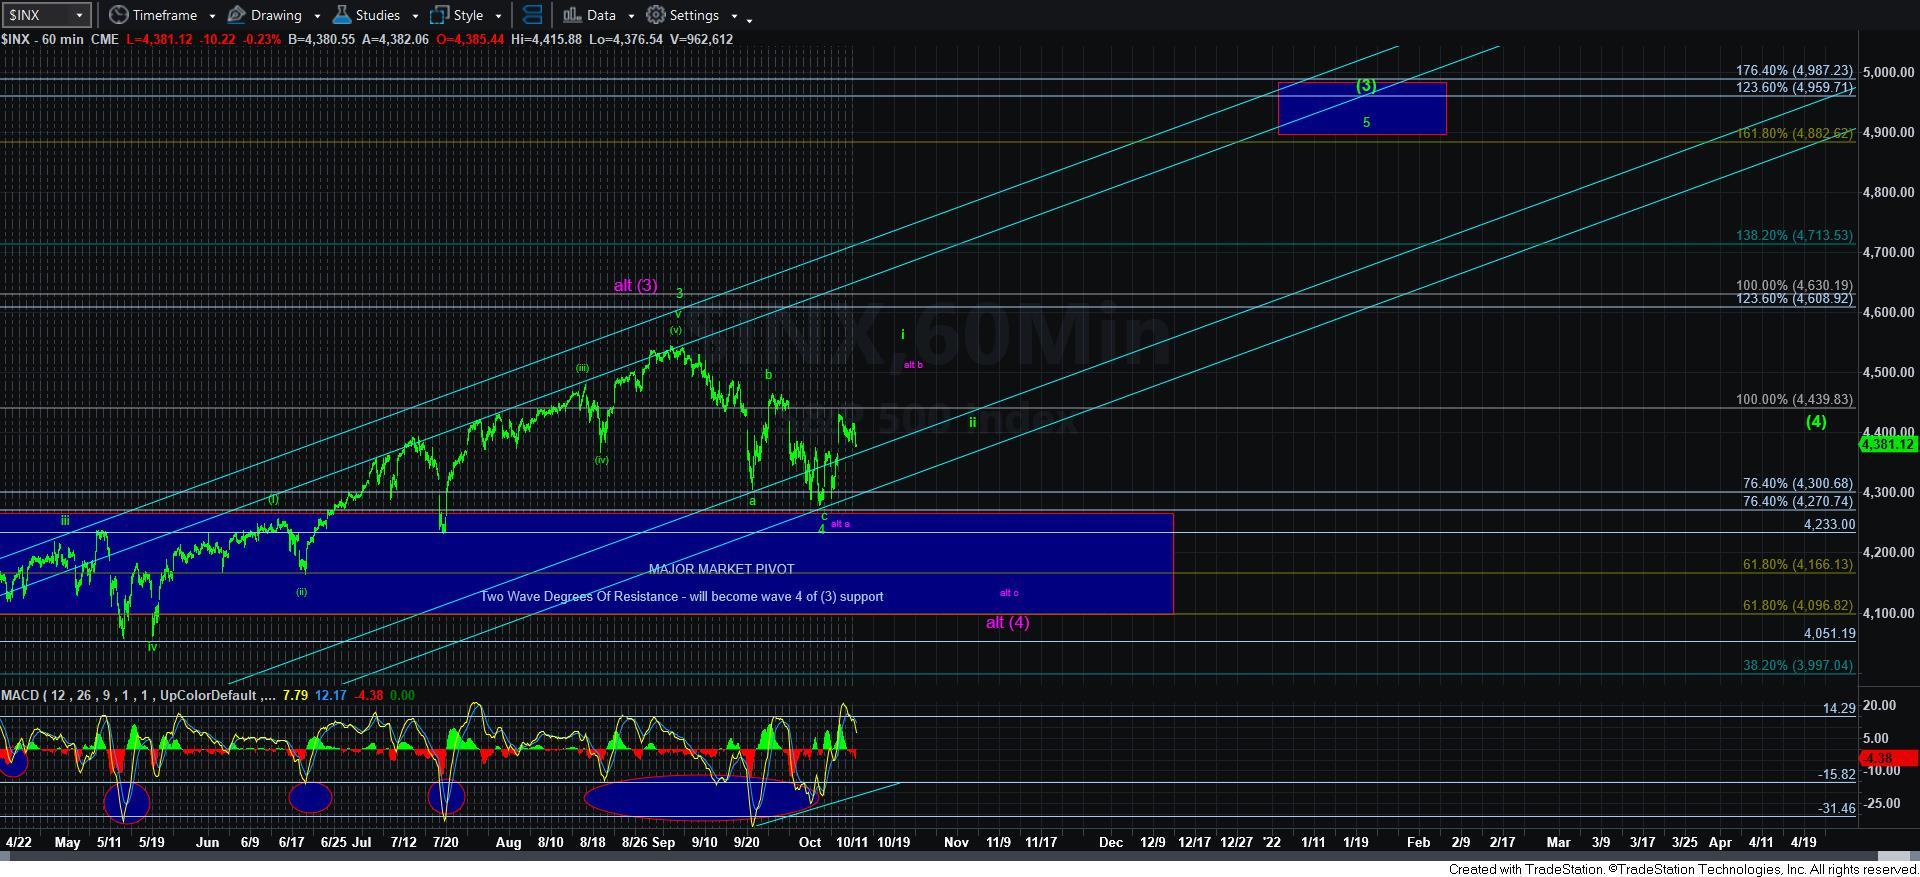
I have outlined the purple count as an prior alternative on my chart, but there are several ways this can take shape. Of course, the market can choose to head directly down to the 4165SPX region from today’s high. However, I do not see a high probability wave count to support that. Another way this can take shape is as a triangle, which would then mean the low has indeed been struck. But, it is way too early to even consider that potential yet.
So, I think we may be stuck in this bigger corrective structure for the b-wave I am outlining in purple for now. It would mean that last week we struck the top of the [a] wave in the [b] wave of the b-wave. That means that today’s high was the b-wave of the [b] wave. And, currently it seems that the market is attempting to set up a 1-2 downside structure for the [c] wave in the b-wave.
I know this sounds complex, but remember that corrective structures are the most complex waves within Elliott’s 5-wave construct. Moreover, the b-waves within the a-b-c structure of those corrective waves are the most complex of all.
Needless to say, today’s action has increased the probabilities that the market will see lower lows, with the 4165-4230SPX region as our next lower support and target. While I am using purple as a guide for now, it is still possible that this is still wave 4 within wave [3], and if we hold 4165SPX, then I am still going to view that as my primary count. But, due to the size of this correction, I am going to have to maintain a close watch on the potential that we are actually one degree ahead of my prior expectations. That means we would be completing wave [iii] off the March 2020 lows in the next rally, and it would point us to 5160+ instead of 4900SPX. I am not willing to opine as to that potential just yet, but will watch how the action unfolds in the coming weeks to make a better determination about that.
For now, the evidence is mounting that this correction has not yet completed. The only bullish structure left for us to suggest a bottom is in place is a leading diagonal, but I do not trust those until they actually complete, as they are not highly reliable at this point in the trend. So, as long as we remain below today’s market high, I am looking down in the [c] wave of b. And, a break out over today’s high can make me consider the leading diagonal scenario a bit more seriously, with a triangle as a second option as well.
But, please remember that trading within these corrective structures is treacherous. There is a reason I say it is akin to throwing jello for distance. And, I can assure you that if we have a bigger b-wave to develop in this region, we will see much more whipsaw in the coming weeks.
While Elliott Wave analysis provides you market context, please use that market context to your advantage and recognize the environment within which you are trading.