Not Much Has Changed – Still Trading Within the b-Wave Territory
 By
By
There’s not a whole lot to add in today’s update, as the market continues to chop within b-wave retracement territory, holding above micro support, but still trading below micro resistance.
At this stage, the pattern at the smaller degree remains unclear, offering little in the way of reliable guidance from a structural standpoint. Until we see a more defined setup, we’re essentially stuck in a holding pattern.
That said, as long as price remains below resistance, I’m still leaning toward a downside resolution on the smaller-degree timeframes. Once (or if) we get that move, we’ll need to carefully assess how price reacts as we approach the larger support levels outlined below.
On the flip side, a sustained move through resistance would open the door for higher levels and potentially shift the near-term outlook. But unless and until that occurs, the cleanest interpretation still points toward at least one more local low before any more meaningful bottoming structure can take hold.
As I noted yesterday, I’m placing greater emphasis on key retracement resistance levels to guide the near-term outlook. As long as we remain below those key retrace zones, my primary expectation is still for lower levels to unfold in the days and weeks ahead. That said, a sustained move back above these retracement levels would prevent me from fully ruling out the potential for another higher high, as we have yet to decisively break key support levels to the downside, the confirmation needed to firmly establish that a top is in place.
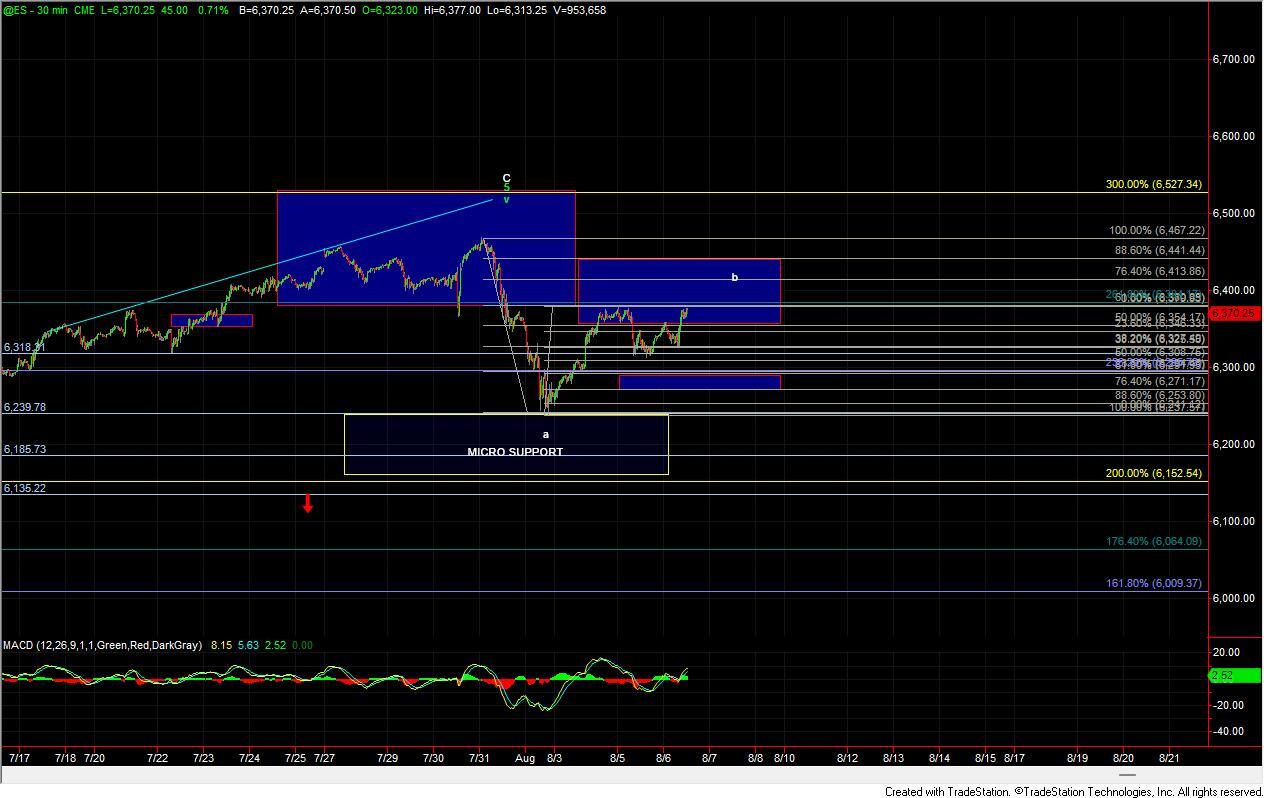
Looking at the ES chart, we currently have overhead resistance in the 6354–6418 zone. As long as the price remains beneath that zone, the path of least resistance remains to the downside. To confirm that a larger wave c decline is underway, we would need to see a clean five-wave move down off one of these fib retracement levels, followed by a break of the 6291-6271 zone and then move through last weeks low to confirm we have topped. Over that support zone and this wave b still could move back over today's HOD before finding a top.
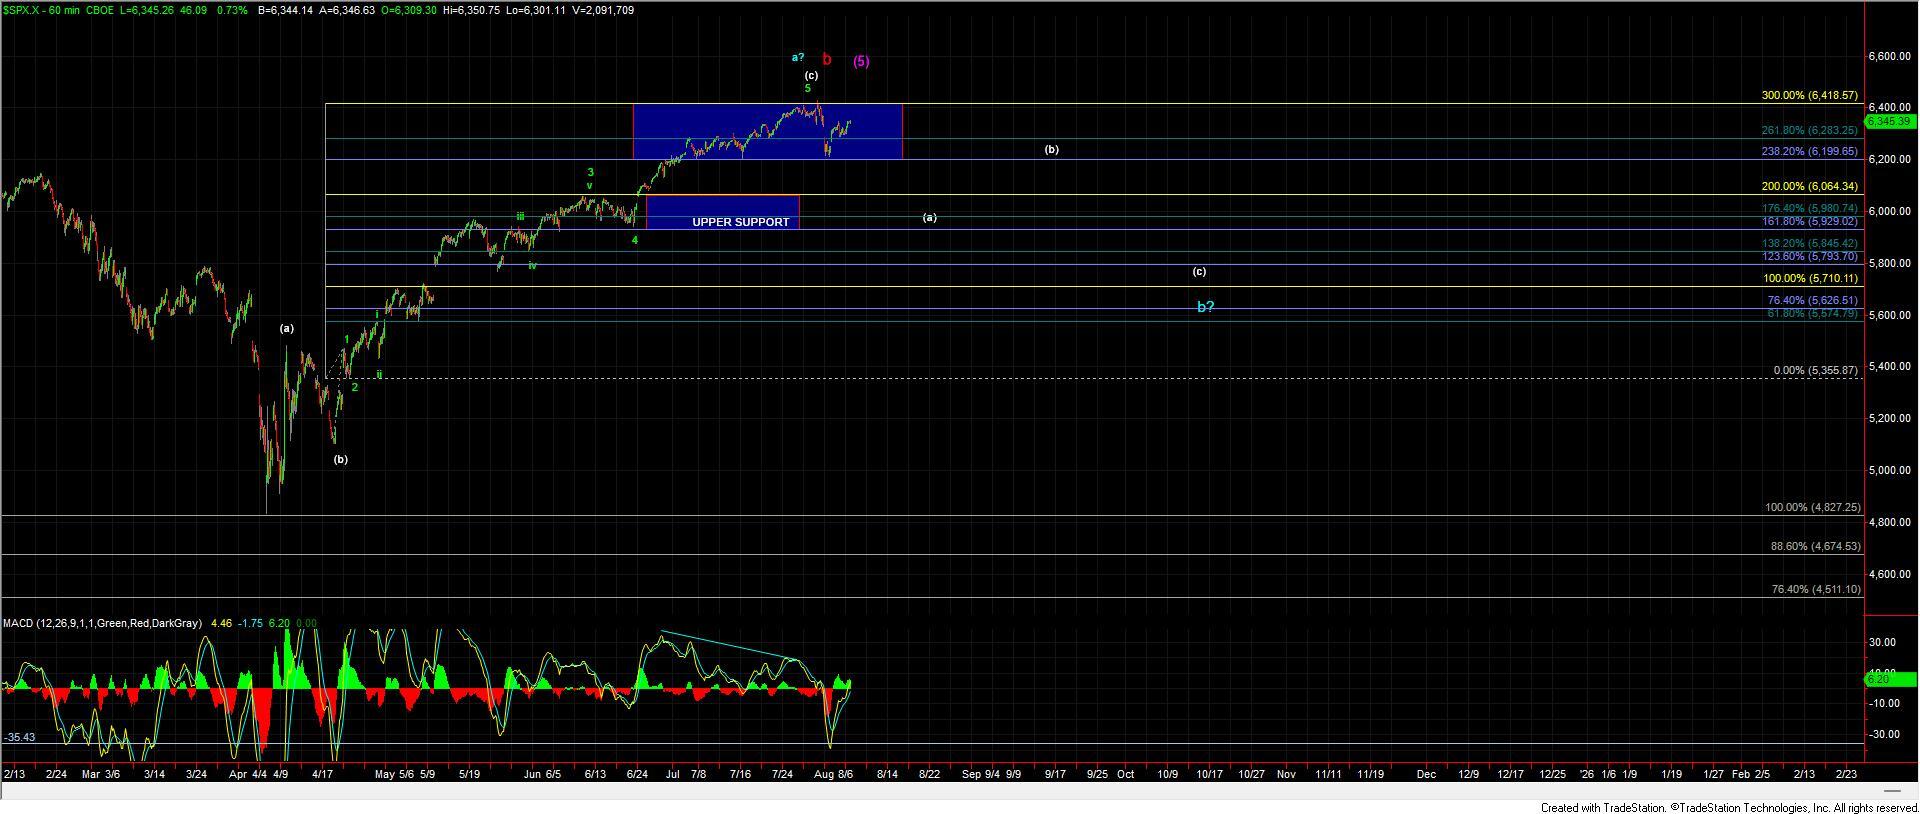
If we can indeed push through last week's low then the next key support/pivot zone comes in at 6241–6152 ES. A move through that zone would offer stronger evidence that a larger-degree top has likely been struck. For the SPX, the larger degree support rests in the 6064–5929 region, and breaking through that level would provide further confirmation of a completed top.
However, if the ES sees a sustained break through the 6418 resistance level, that would reopen the door for a continued move higher toward the 6527 region above.