Not Just Green Shoots Now
Oftentimes, when a market gets extremely oversold, the move off that low does not provide us with much in the way of pullbacks. Yet, in Elliott Wave analysis, the pullbacks are like road markers, telling us where we are on our path.
So, this morning, I posted this alert to our members:
“Everyone take a breath. This has been a very difficult market, and many seem quite stressed out . . and I can understand why.
Many of you are trying to glean what seems to be "certainty" as to whether we finally have a bottom in place. This market does not offer that . . especially in this current environment. But, when we invalidated that smaller alternative red count I had on my chart pointing to much lower, it began to turn probabilities into a low being struck.
Moreover, I said that I wanted to see a nice 5-wave structure off a low, followed by a corrective pullback, thereafter followed by a rally over the high of the initial 5-wave rally to make it highly likely a bottom has been struck. Thus far, we have not really seen an appropriate 1st and 2nd wave of that caliber yet.
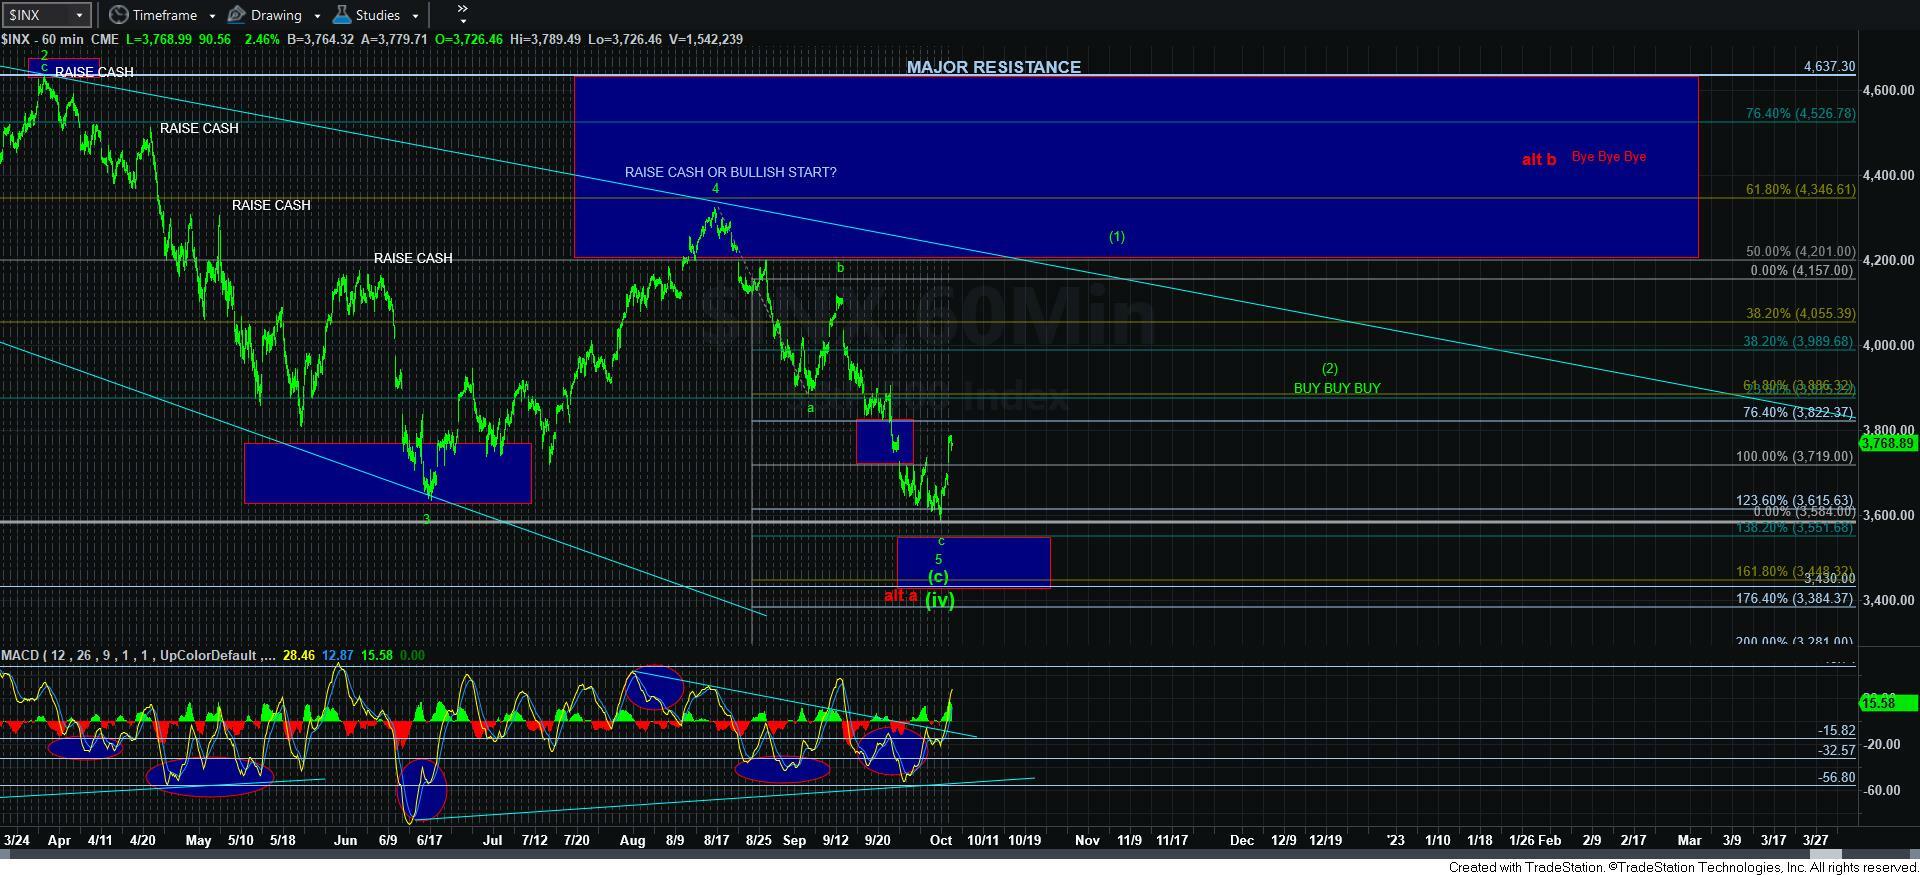
However, if the market now takes out the main resistance region in direct fashion, it makes support 3770ES, and would suggest that a larger 5-wave rally is potentially taking hold off the lows.
But, in the bigger picture, the question many of you want to know is where do I put my cash back to work. And, there is no one easy answer. Some of you may choose to allow the first 1-2 to complete (which, as noted above, really has not yet), and then may look to deploy some of that cash. Some of you may want the bigger (1)(2) on the 60-minute to complete before you deploy your cash. And, all of this is based upon your own risk tolerance.
So, for now, I am in a "patient" mode and allowing the market to develop to tell me where I want to deploy my cash. Furthermore, it is possible that we may only get the bigger red count on the 60-minute chart, which would likely make me move into the TOP IS IN perspective. I am clearly not there yet, but will be listening to Mr. Market on this rally.”
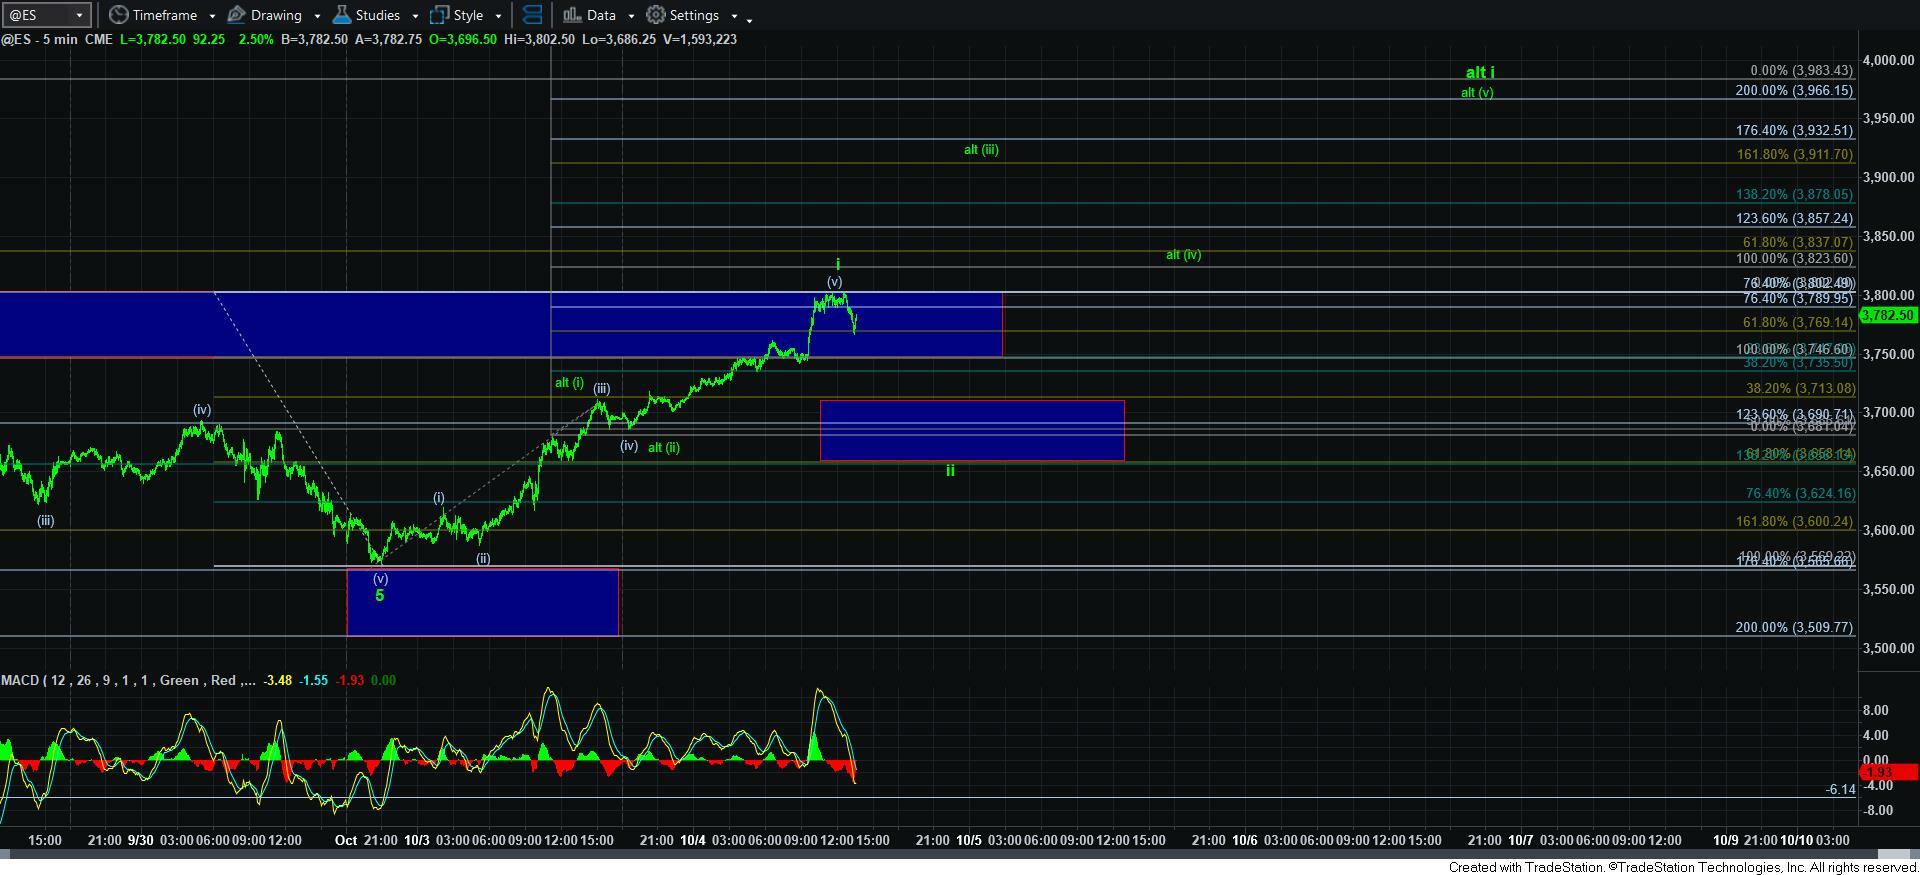
In our current case, the market really has not provided us with much in the way of pullbacks to provide us with a high probability smaller degree wave count off the low. Therefore, I have to feel out where we are in the overall structure. The reason I outlined the top of our resistance box on the 5-minute chart as a key point is because it also represents the .764 extension of the alt [i][ii] structure. You see, it is VERY rare that a 5th wave will exceed .764 times the size of waves [i]-[iii]. Therefore, should we exceed that resistance, it suggests that some other count is playing out, which is why the alt [i][ii] count was presented.
As I write this update, the market is in the process of turning down exactly from that resistance. And, if we indeed topped in an initial 5-wave structure off the low representing wave i, then our support for wave ii is in the 3655-3715ES region, as represented by the blue box on the 5-minute ES chart.
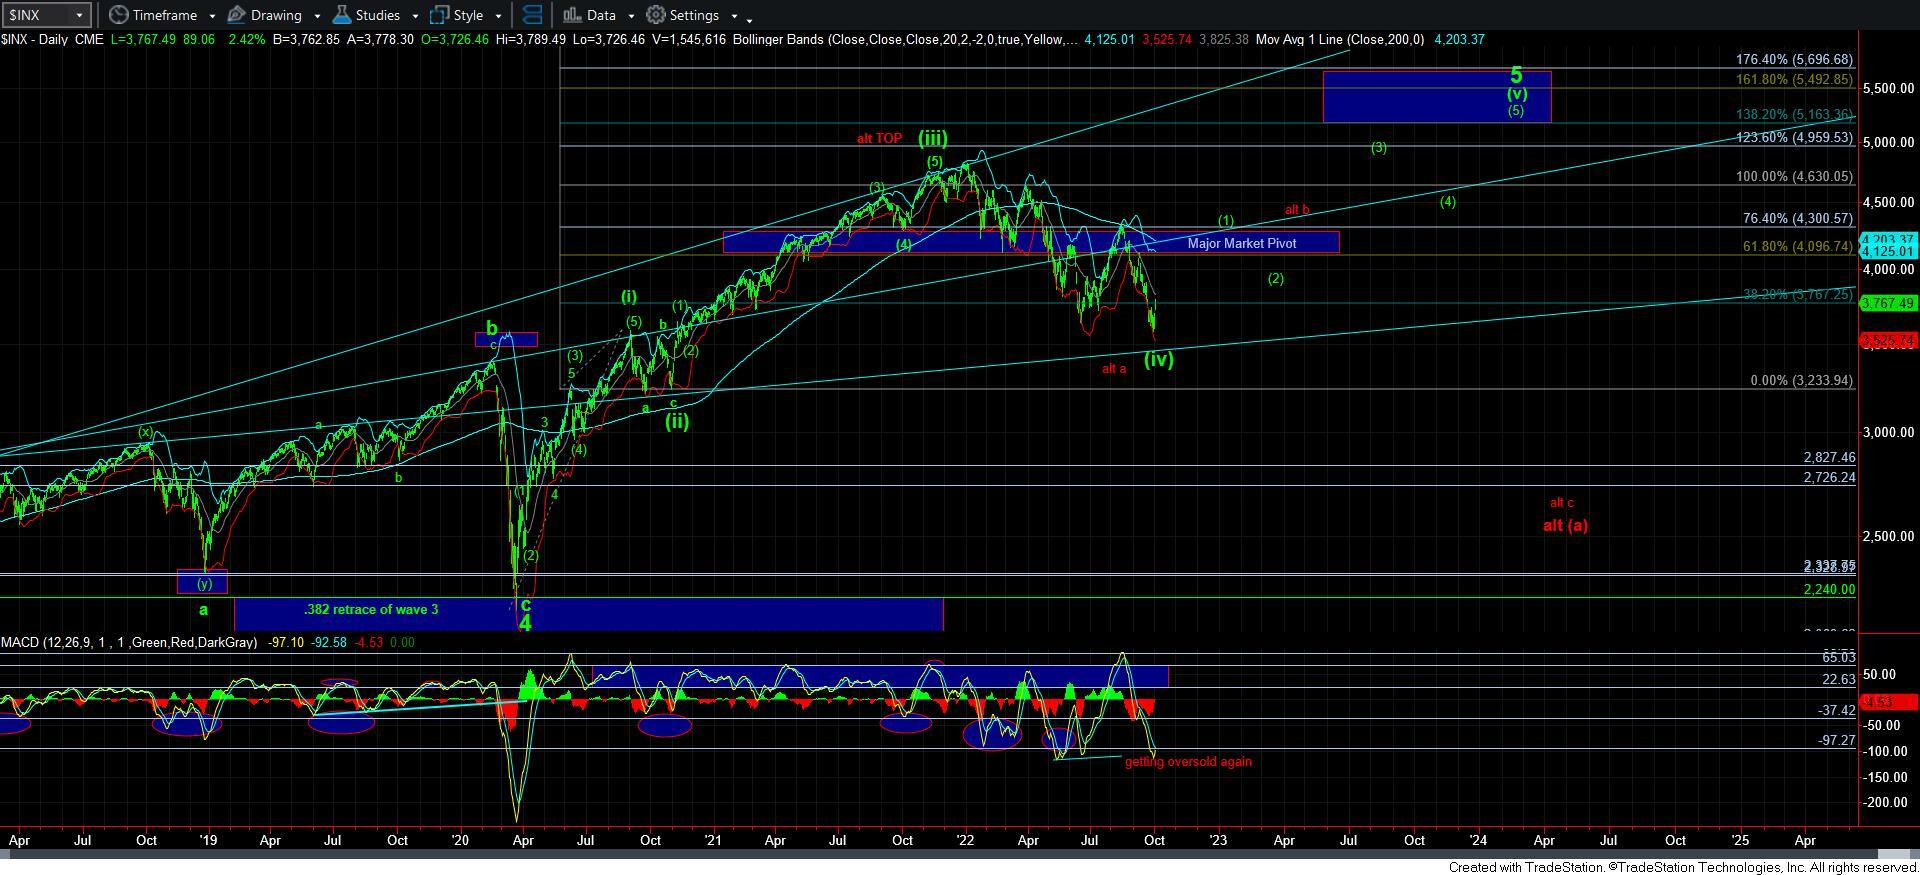
I have also posted the daily chart, as I want you to see again just how oversold we were at the lows – as I highlighted this past week – and how much room we have in the MACD for a rally.
So, again, the only question is how this rally takes shape. One way or another, I think we are getting a 5-wave rally off the low, which leaves me well within the green count, and still pointing to higher highs. However, if the bulls are unable to follow through and complete a larger degree 5-wave rally to complete wave [1] off the lows, then I may be moving into the TOP IS IN count. For now, I am still very much in green – although, with all the bearishness around, it certainly is not easy being green. (smile)