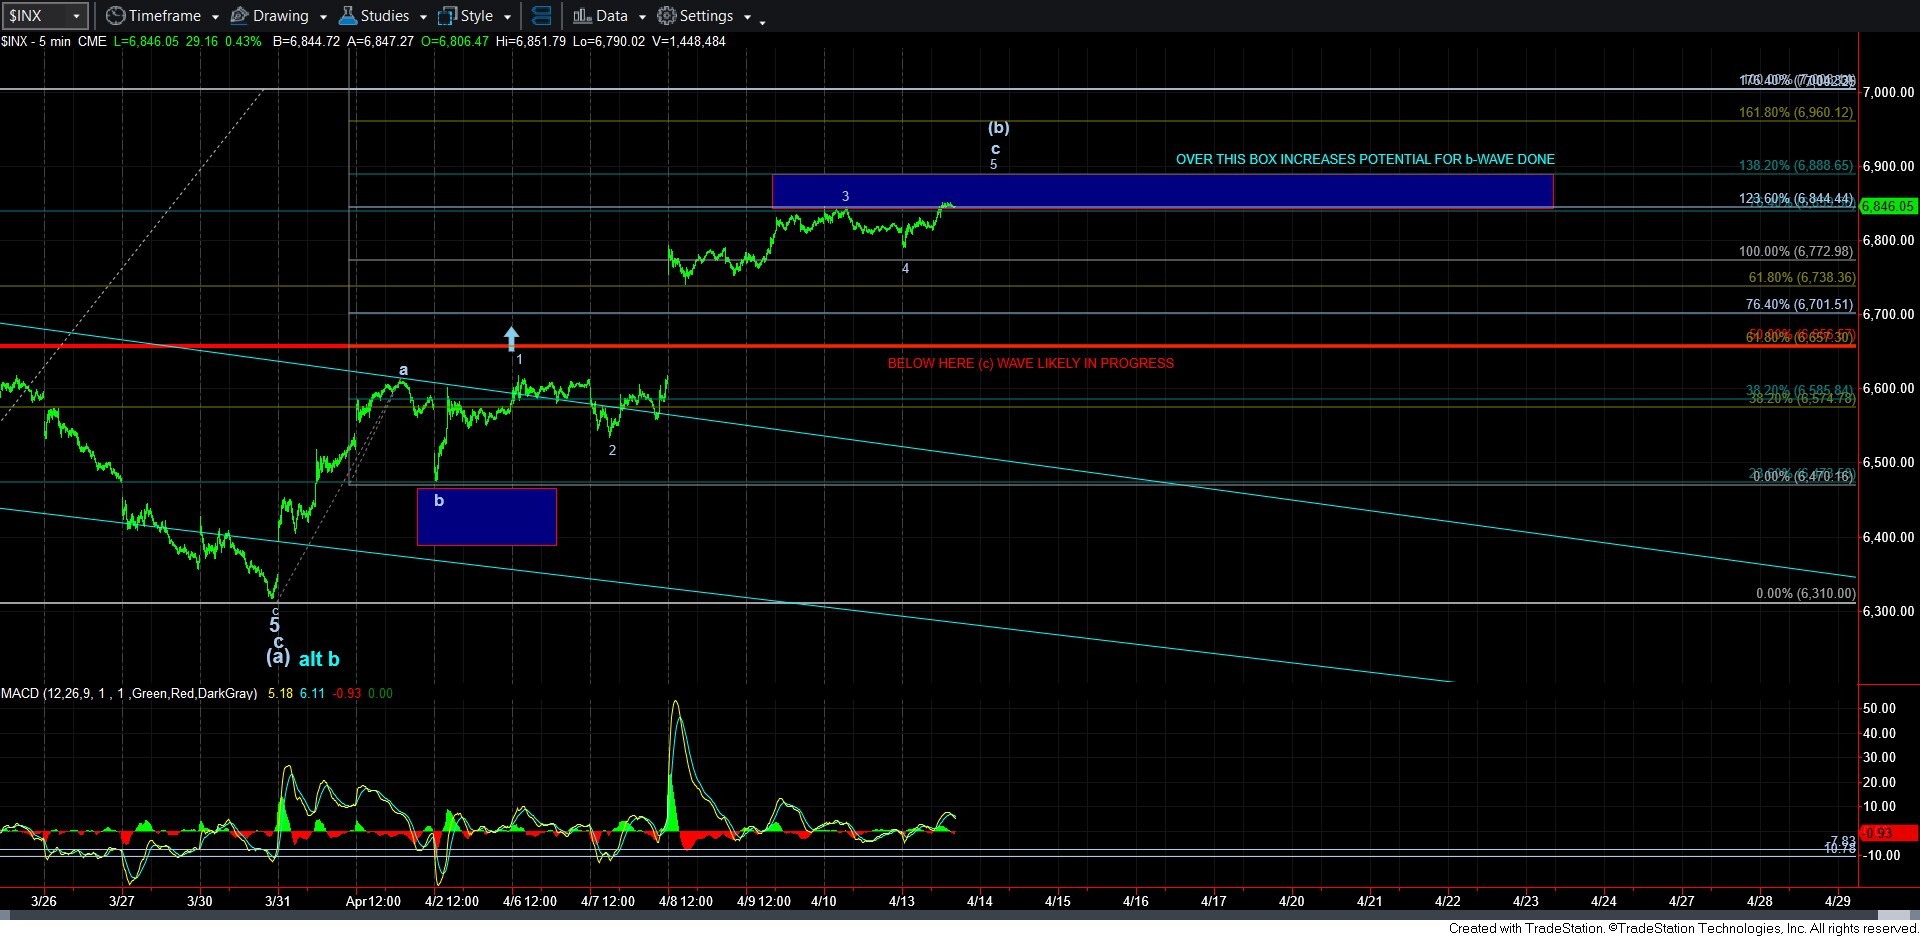
No Top Yet - Market Analysis for Apr 13th, 2026
As I outlined over the weekend, we would have needed to begin breaking support early this week in impulsive fashion in order to suggest a (b) wave top was in place. But, that is not what we have seen.
Rather, the decline in the futures really seems to be a 3-wave event which can be counted in two ways.
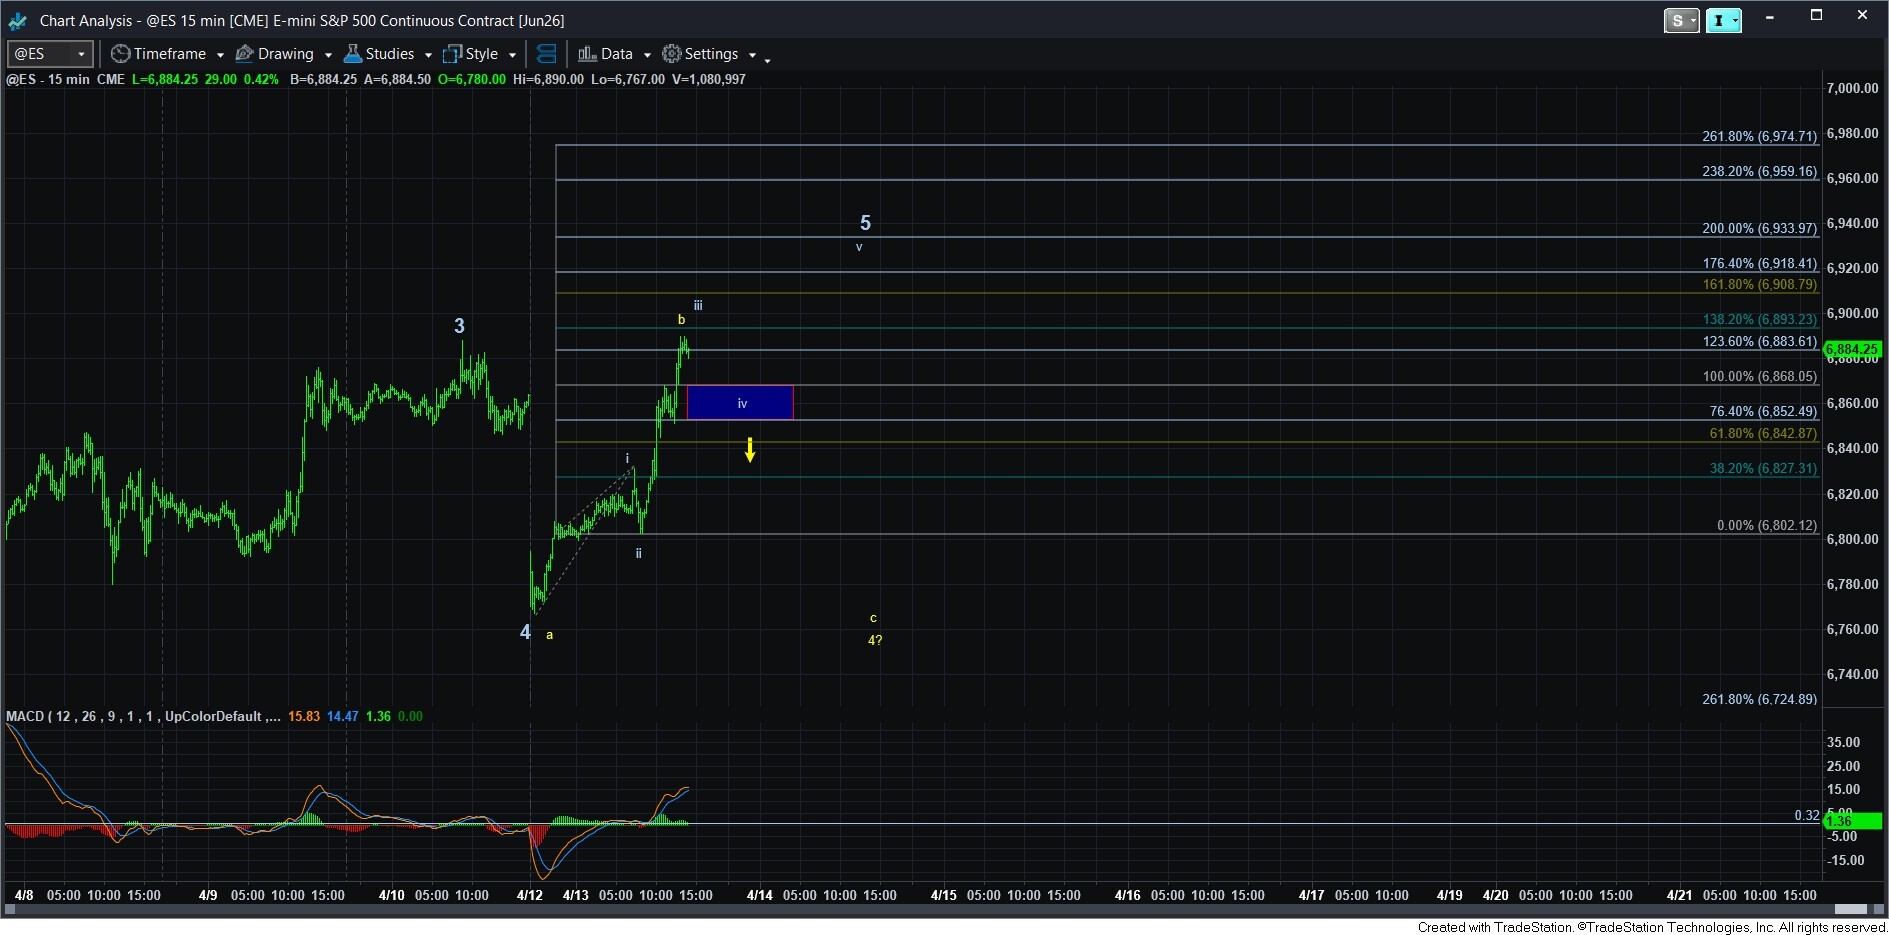
To be honest, I really like the yellow count on the 15-minute ES chart. That suggests that the overnight low was an a-wave of wave 4, this rally is a b-wave of wave 4, and a c-wave decline is yet to be seen. We would need to break the support box for wave iv of 5 to suggest that we are dropping down to complete a 4th wave flat back towards the overnight low. And, if we could see this decline during market hours, we can strike the lows we struck in the overnight session, which would make for a more reasonable 4th wave pullback, as the one in the SPX right now as shown is very, very shallow. So, it really would tie a nice bow onto this wave structure if we could see a c-wave decline during market hours, whether that is today or tomorrow.
The other option is the more direct completion of wave 5 of the c-wave of (b). And, as long as the market holds over the support box on the 15-minute ES chart, we have no strong indication that the 4th wave is an ongoing flat other than it would make for a very nice structure.
So, in summary, how the market handles the support box on the 15-minute ES chart will likely decide between these two paths.