No Man’s Land
 By
Avi Gilburt
By
Avi Gilburt
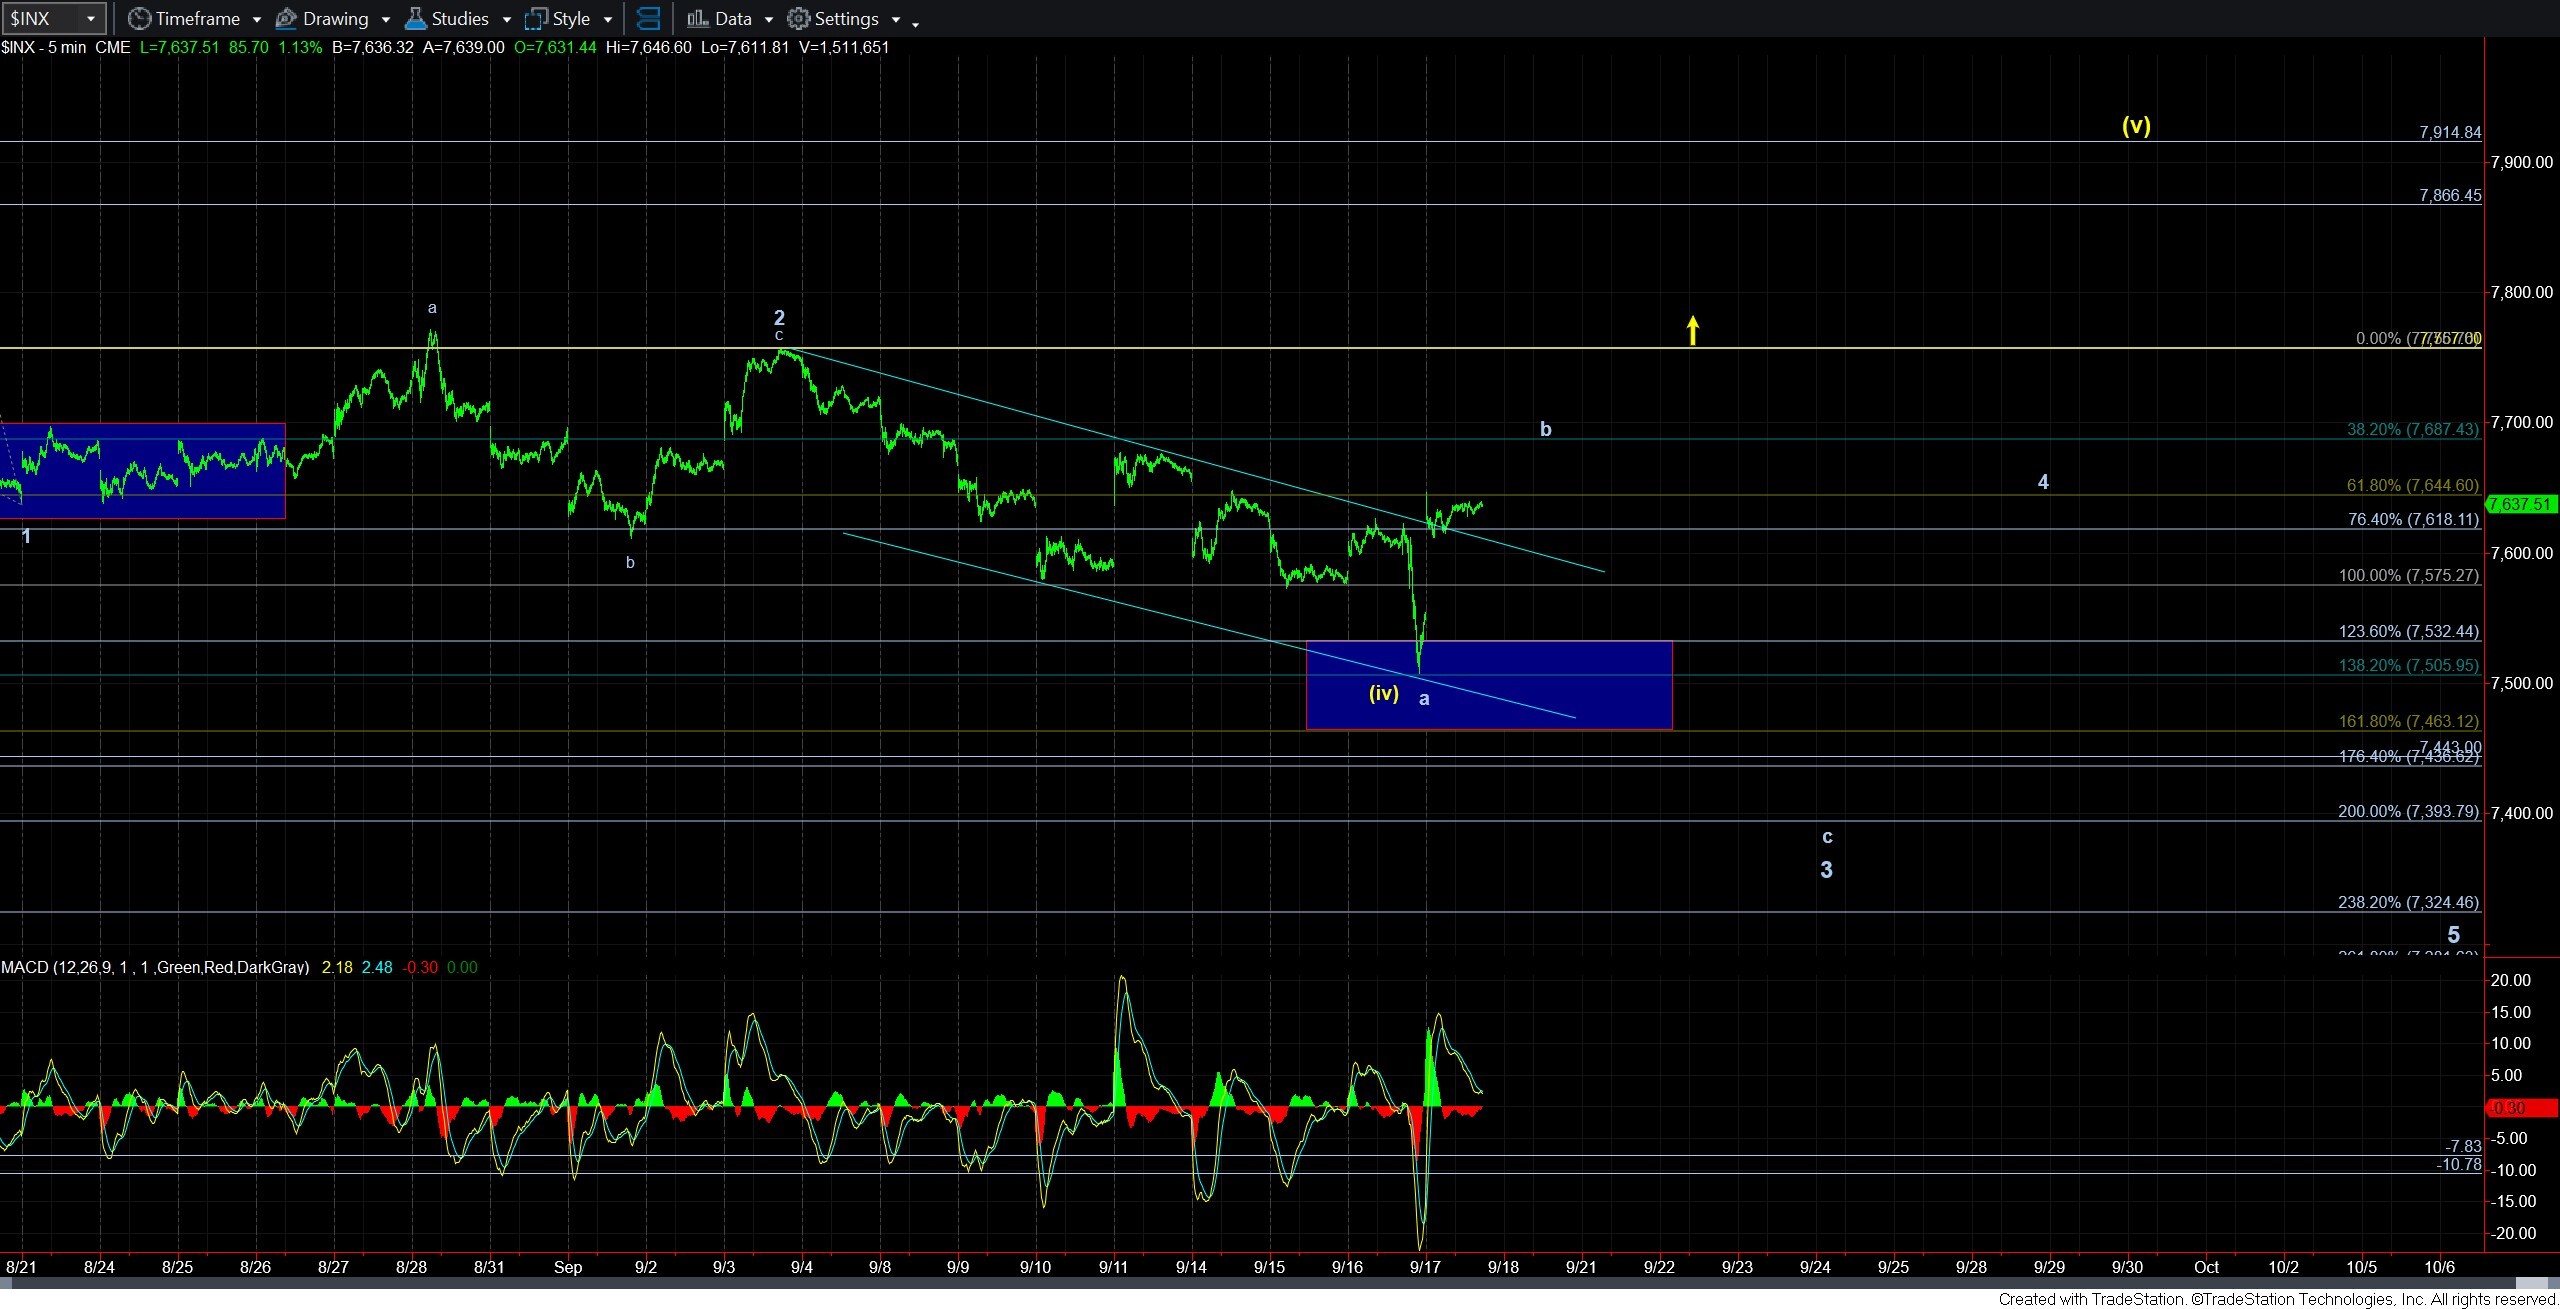
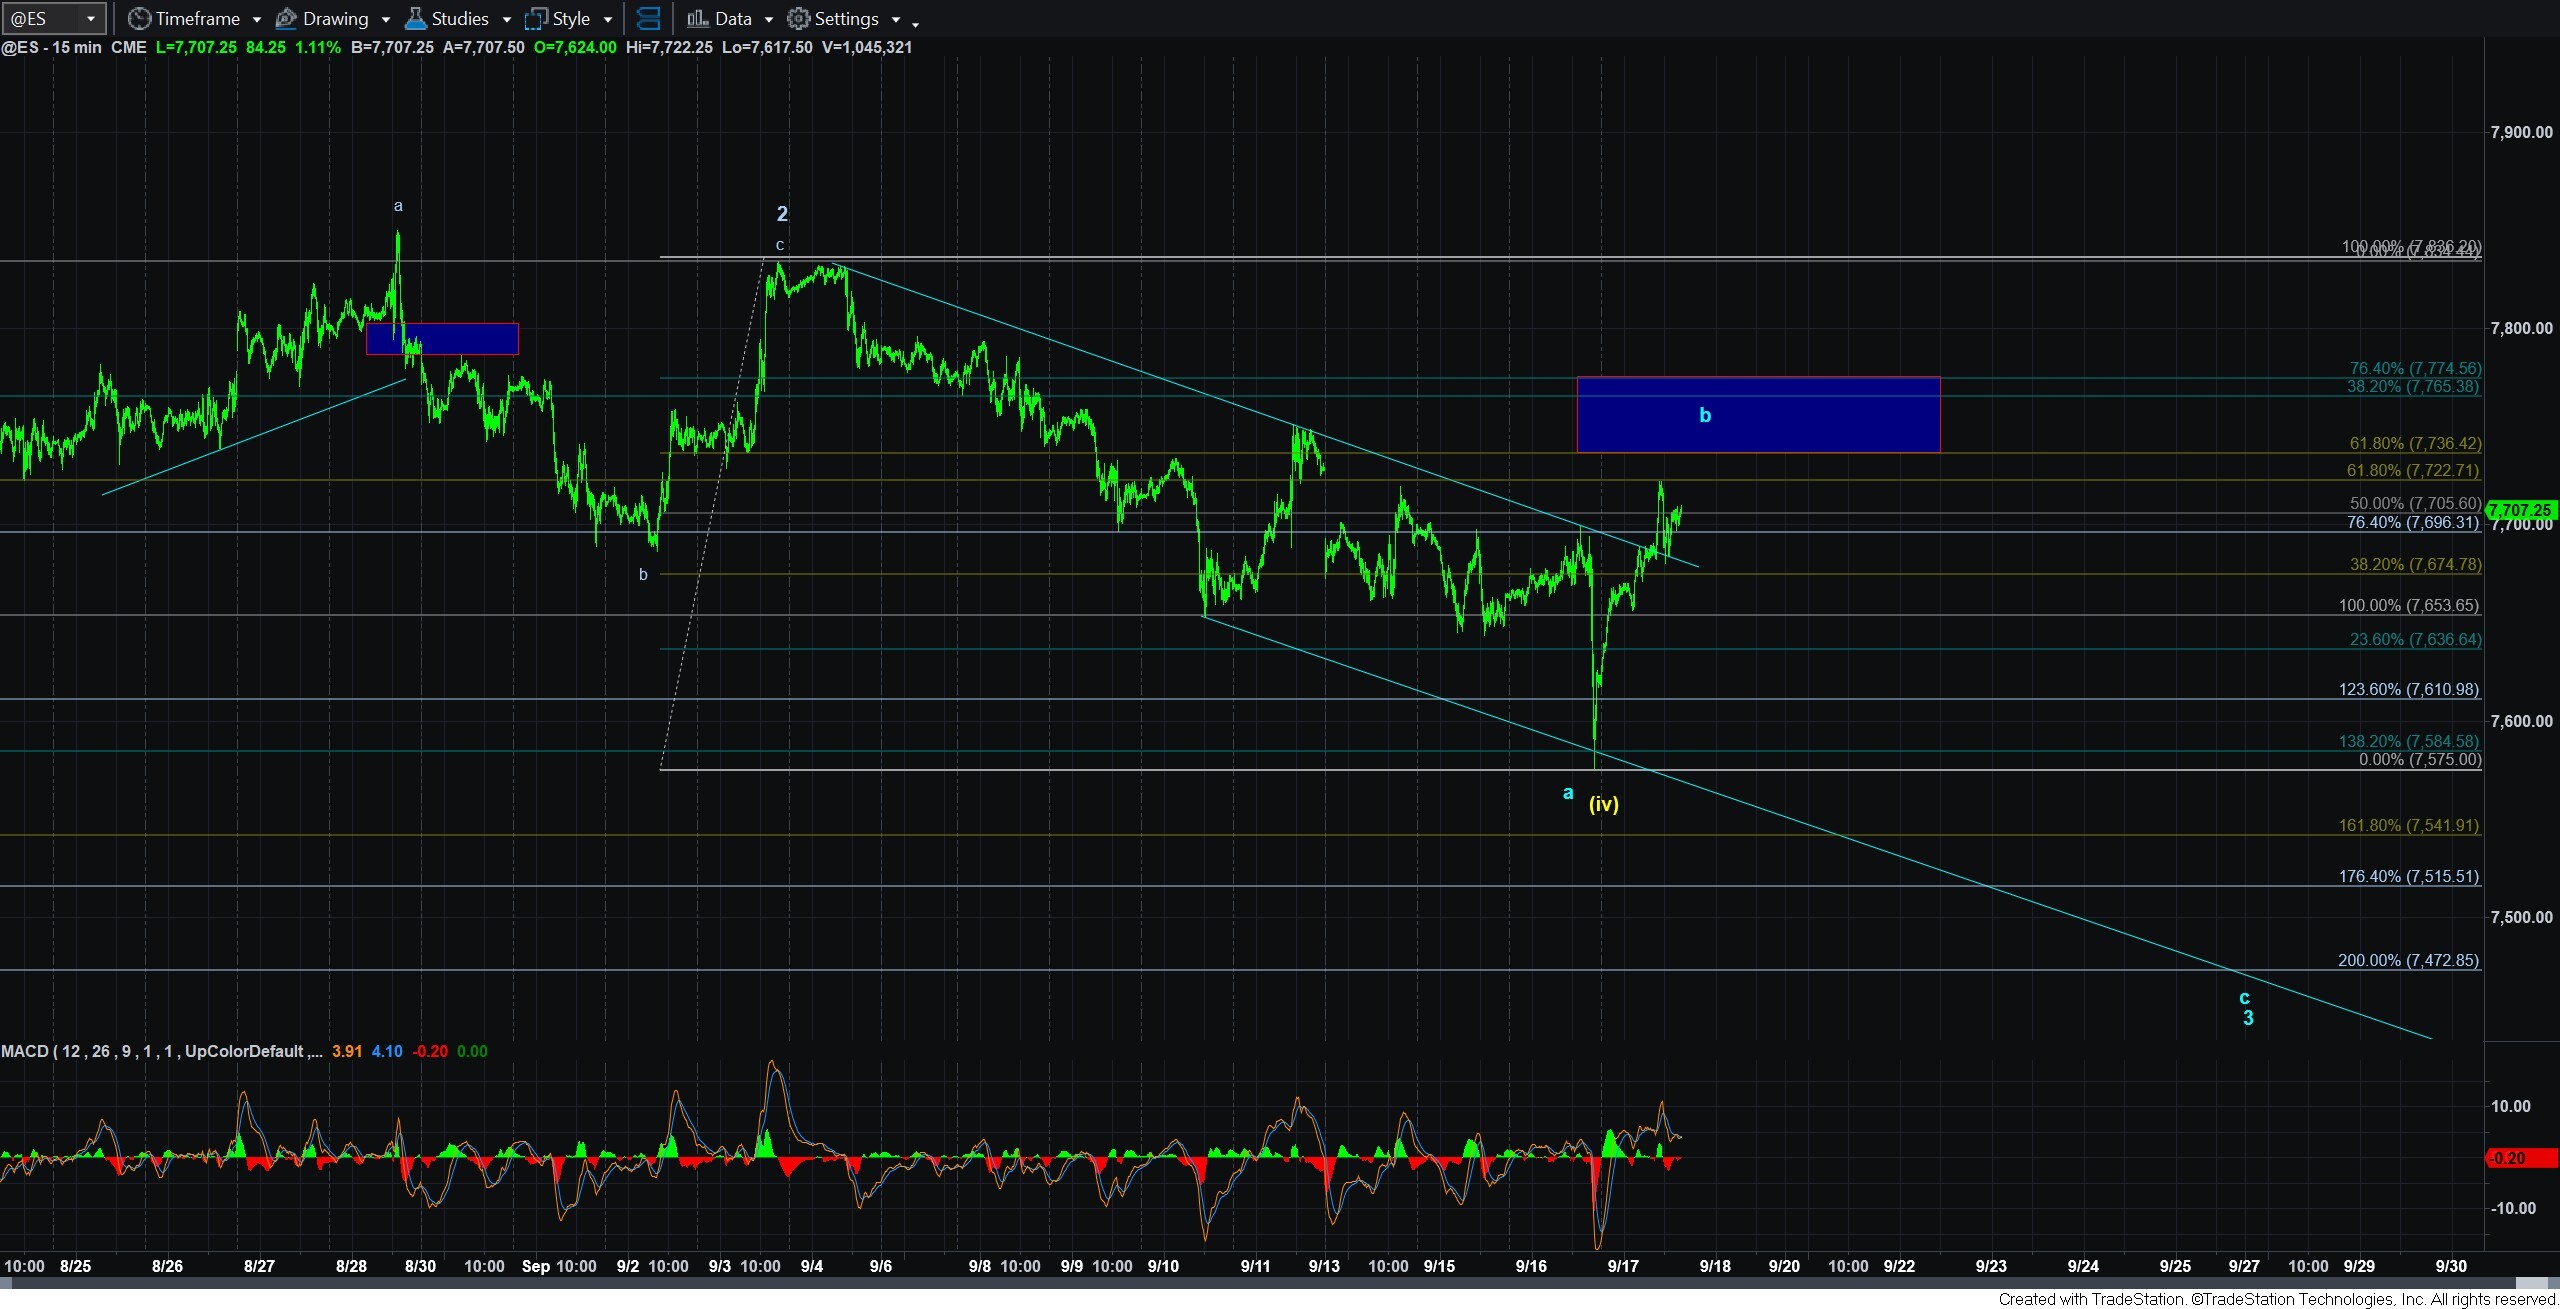
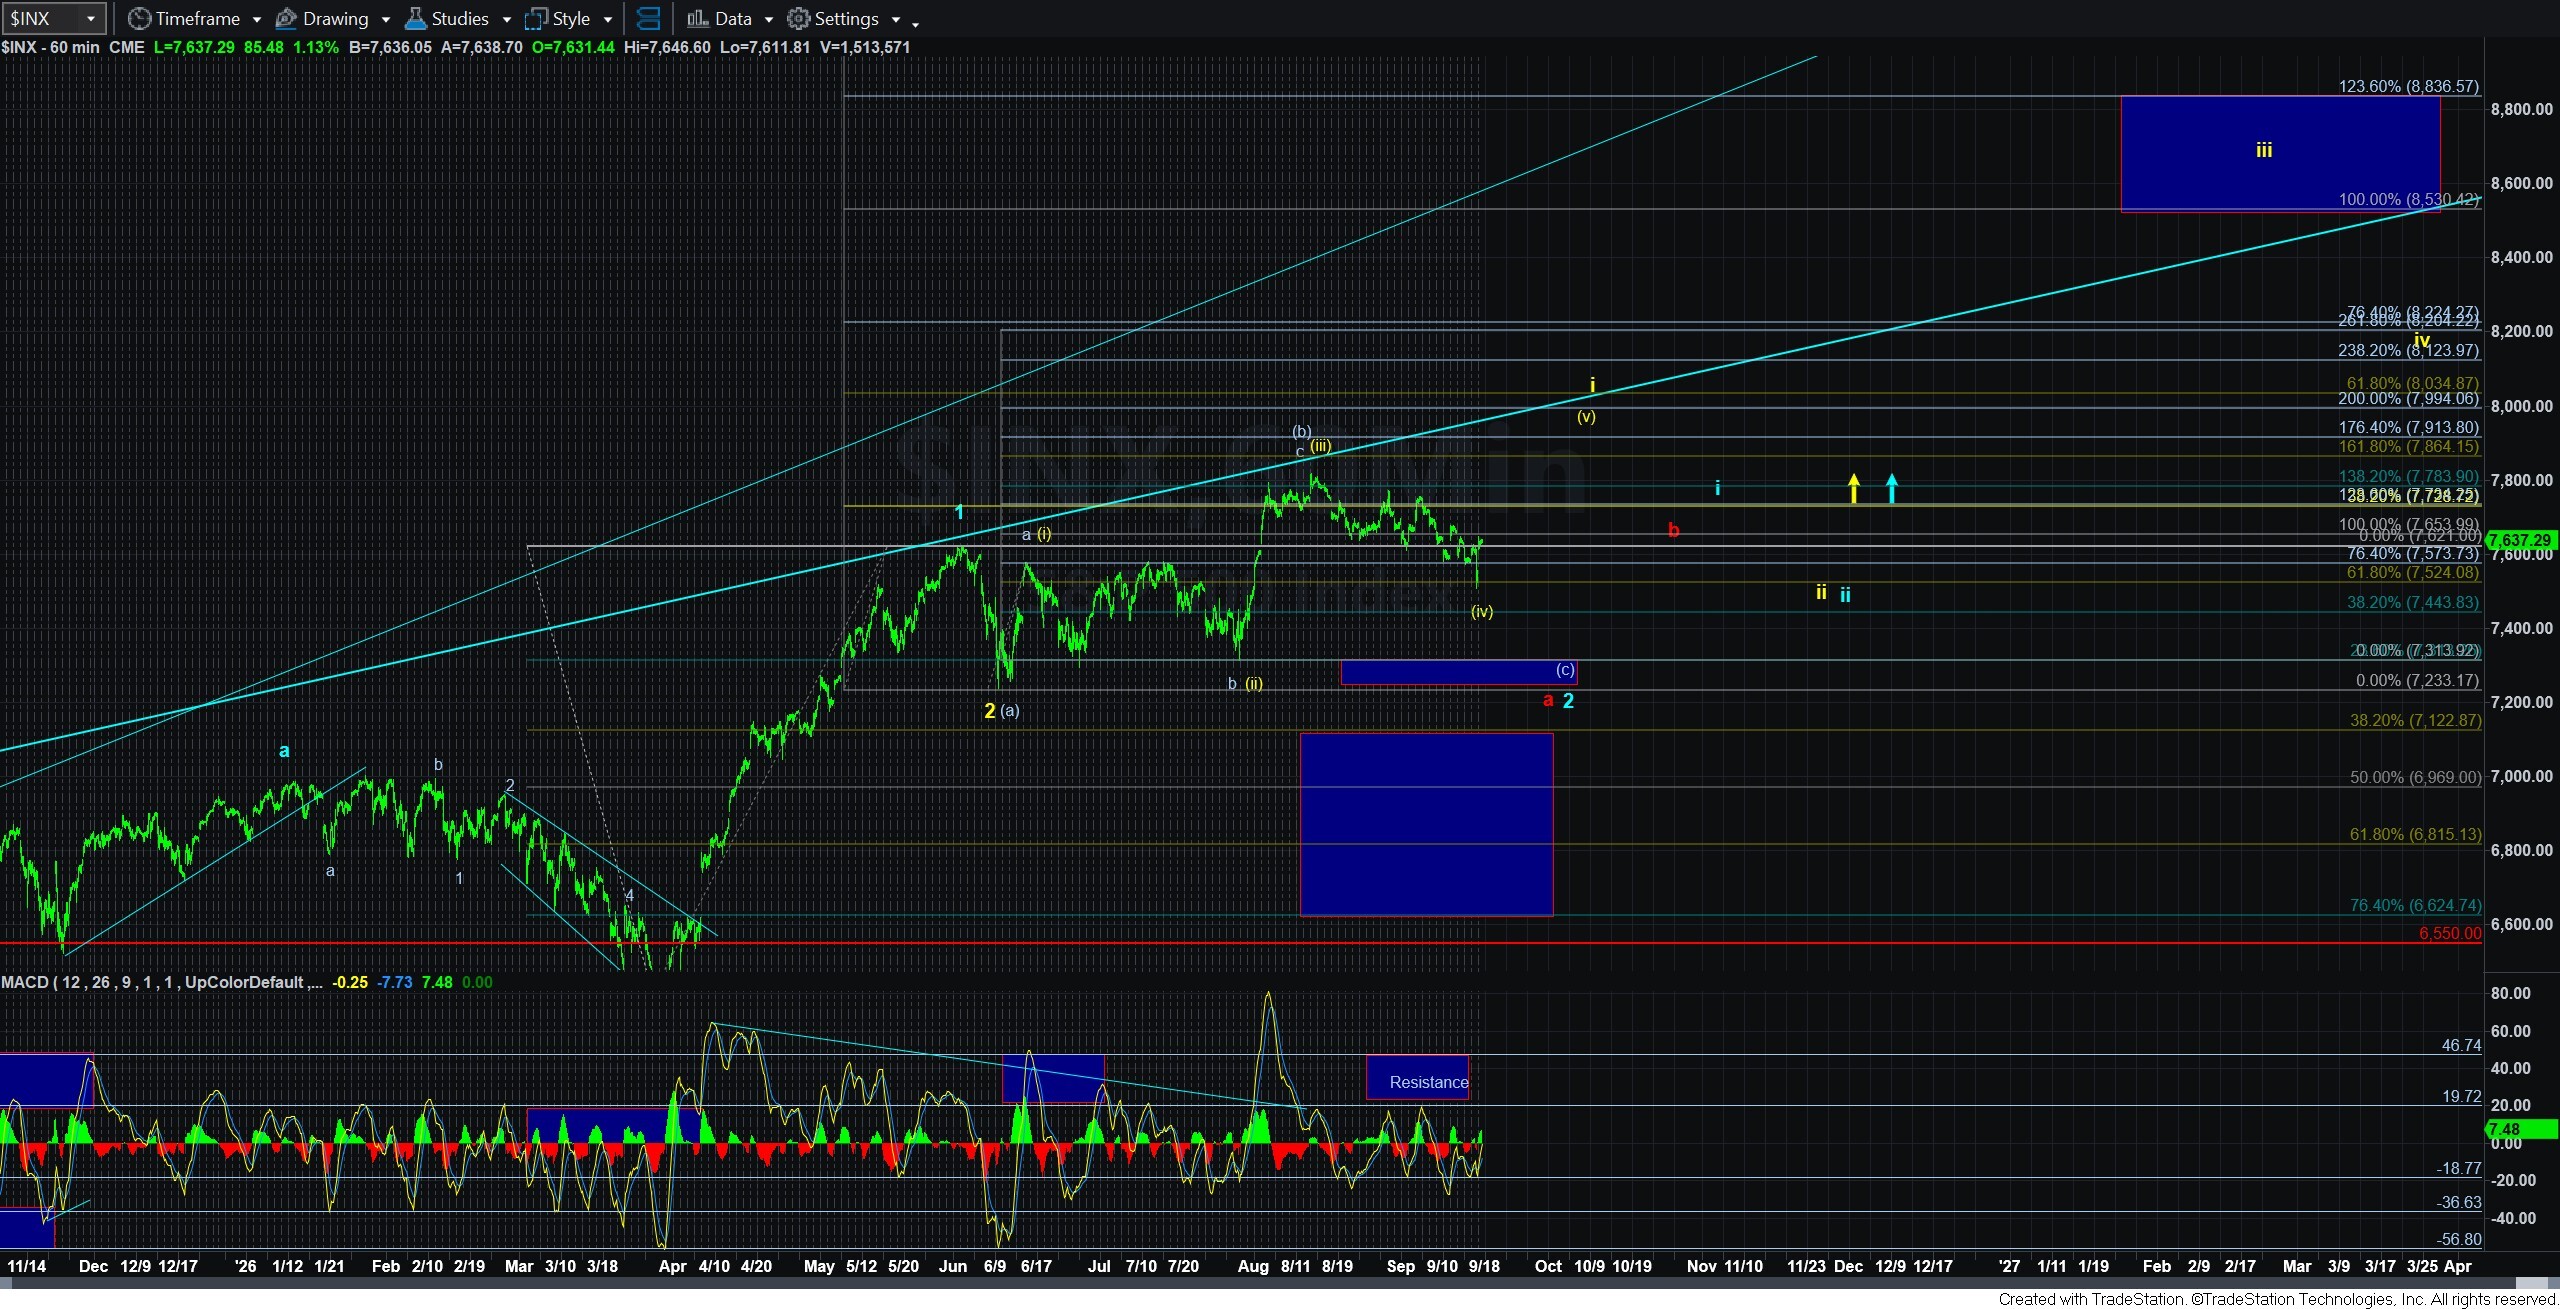
As I wrote earlier this week and this morning again, with the taking out of lower resistance ovenight, we have moved into no-man’s land wherein I do not believe we can view one potential as being a higher probability than the other on the 5 and 15 minute charts. Although I will add that the downside path has a greater Bayesian probability than the yellow count based upon Luke Miller’s work, I cannot say that the two Elliott Wave counts being presented here stand out on their own as one being a higher probability than the other.
In the blue count, yesterday’s low completed a very overlapping and unclear a-wave decline. And, that would make the current rally a b-wave, with the resistance for this b-wave being presented on the attached 15-minute ES chart. Clearly, should we exceed this resistance is would increase the yellow count probability even further, and a break out over the wave 2 high would invalidate the blue count as shown, and likely cause us to move to the yellow count as our primary count.
For the blue count, we are seeking an initial 5-wave decline to suggest the c-wave down has begun.
No doubt that this action has been exceptionally challenging. But, I still expect the market to clarify our big picture view between the blue and yellow paths over the coming weeks and maybe even months. But, due to the fact we have no clear indications that a major top has been struck, my assumption is that once the market clarifies its near term path, it will likely open the door to the path pointing us north of 9000SPX in 2027. So, while it forces us to maintain patience with the SPX, I still encourage all of you to be reviewing individual stock analysis being put out by our StockWaves team as there are some interesting set ups into which I myself have been buying.