No, I Don’t Think We Topped Yet
In yesterday’s analysis, I noted that I thought the direct move higher had a small advantage based upon where we were at the time of my writing the update. And, with this morning’s move through resistance, it made that a high probability.
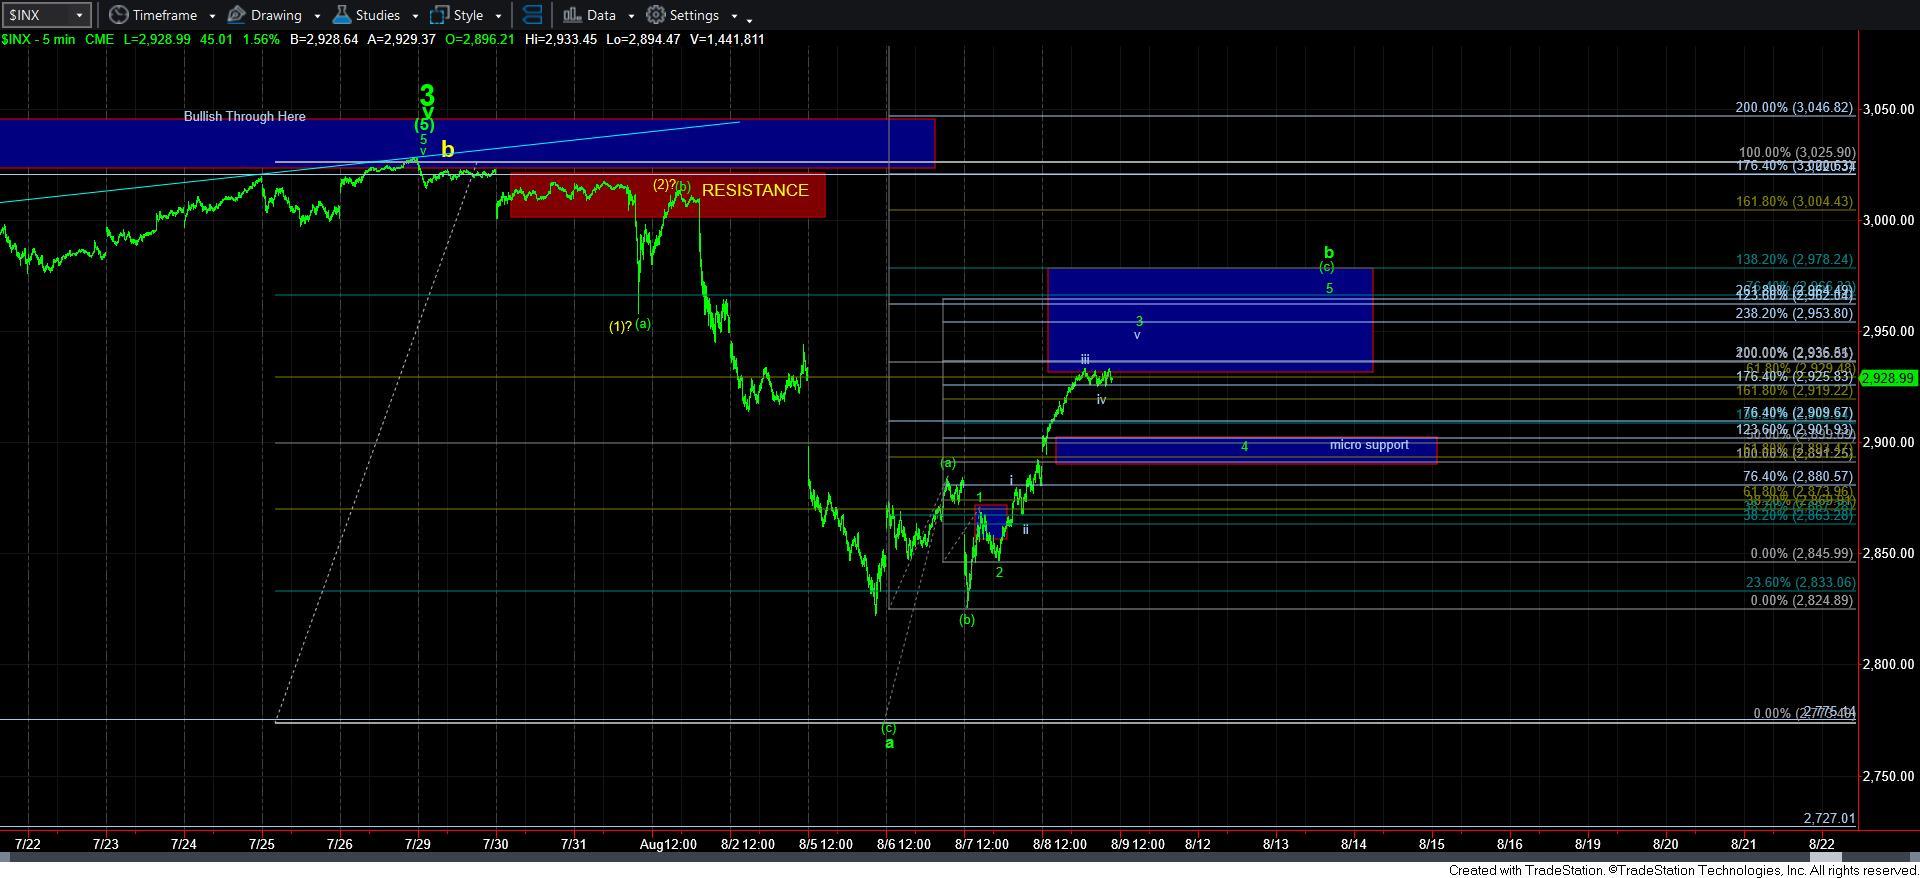
As I also noted, the 2930SPX region was my preferred target, and was the lower end of our target box for a b-wave rally. However, simply because we have struck my target does not mean that I think we have topped.
You see, when we track a c-wave rally, they are normally 5-wave structures. So, we need to see a completed 5-wave structure in the c-wave rally before we can be more certain that this b-wave has topped. Thus far, I only see us as completing wave 3 of the [c] wave of b. This is how it is annotated on my 5-minute chart.
This means that I am still going to expect a wave 4 pullback, followed by a 5th wave higher before I can view this [c] wave rally as potentially completed. Support for that 4th wave is in the 2890-2902SPX region, which should hold as support and set us up for a 5th wave to complete this rally.
Now, of course, there are the rarer instances where we see a w-x-y corrective rally, wherein this segment of the rally would be topping at this time. Again, I want to stress that this is a much more rare pattern so it is not something I would view as a higher probability at this time. Rather, I would need the market to prove that to be the case with an impulsive drop below our micro support region between 2890-2902SPX.
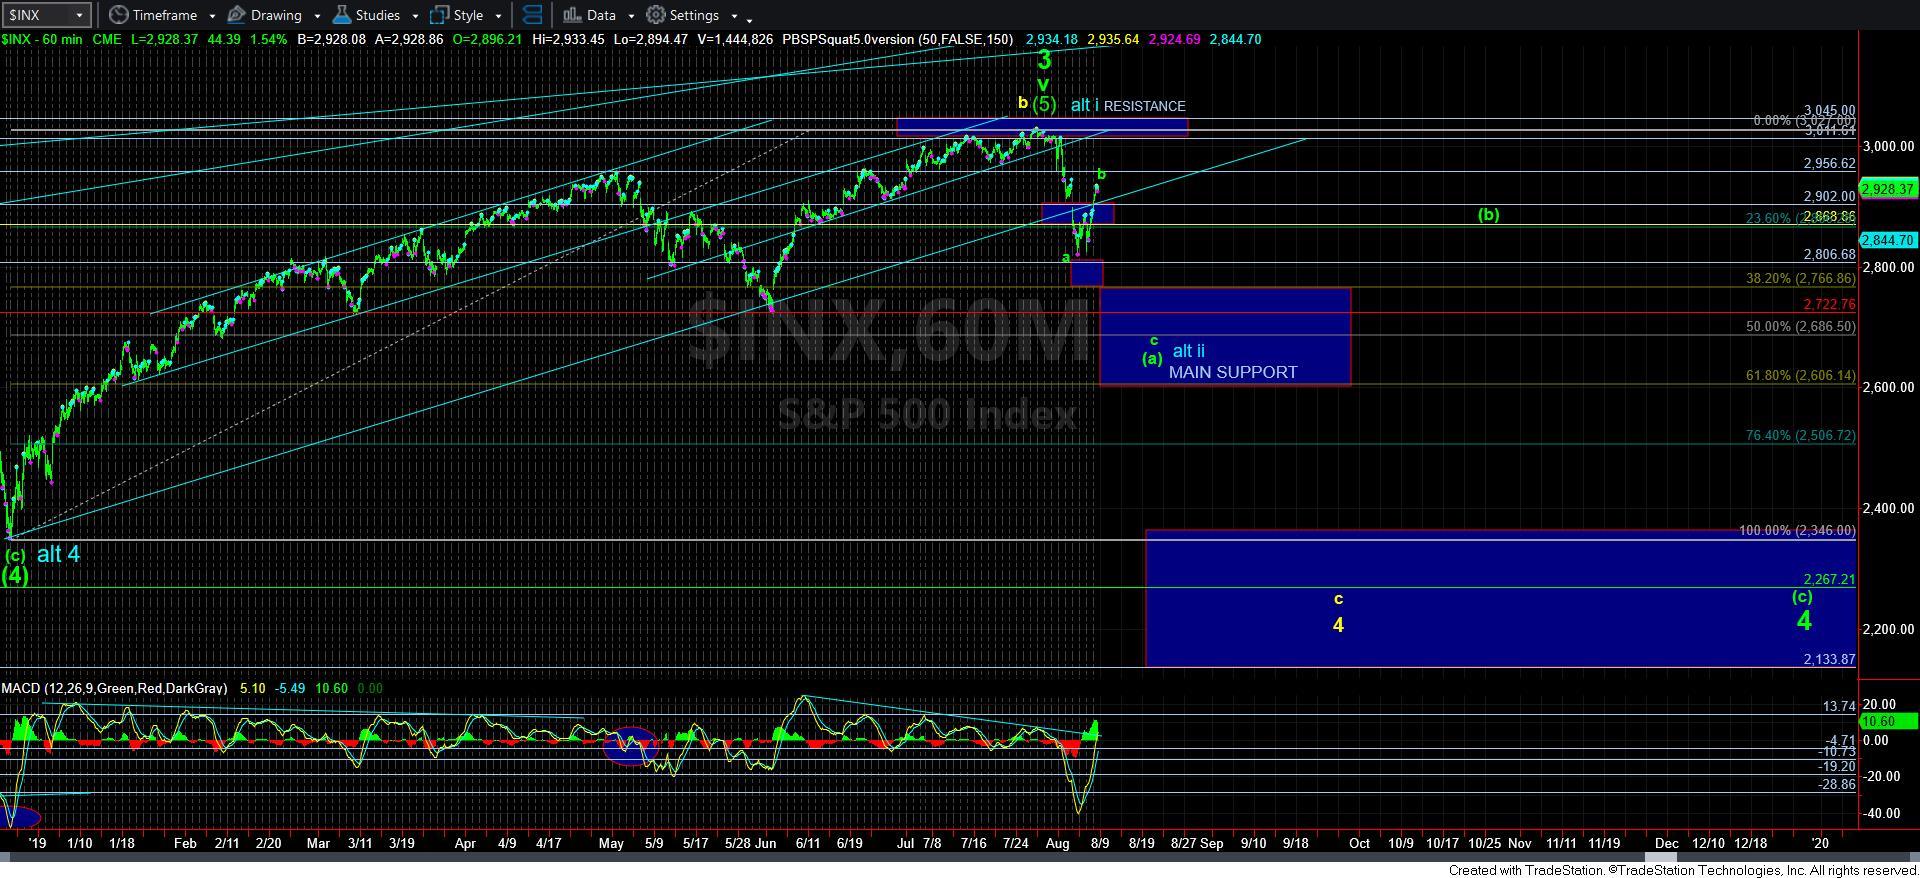
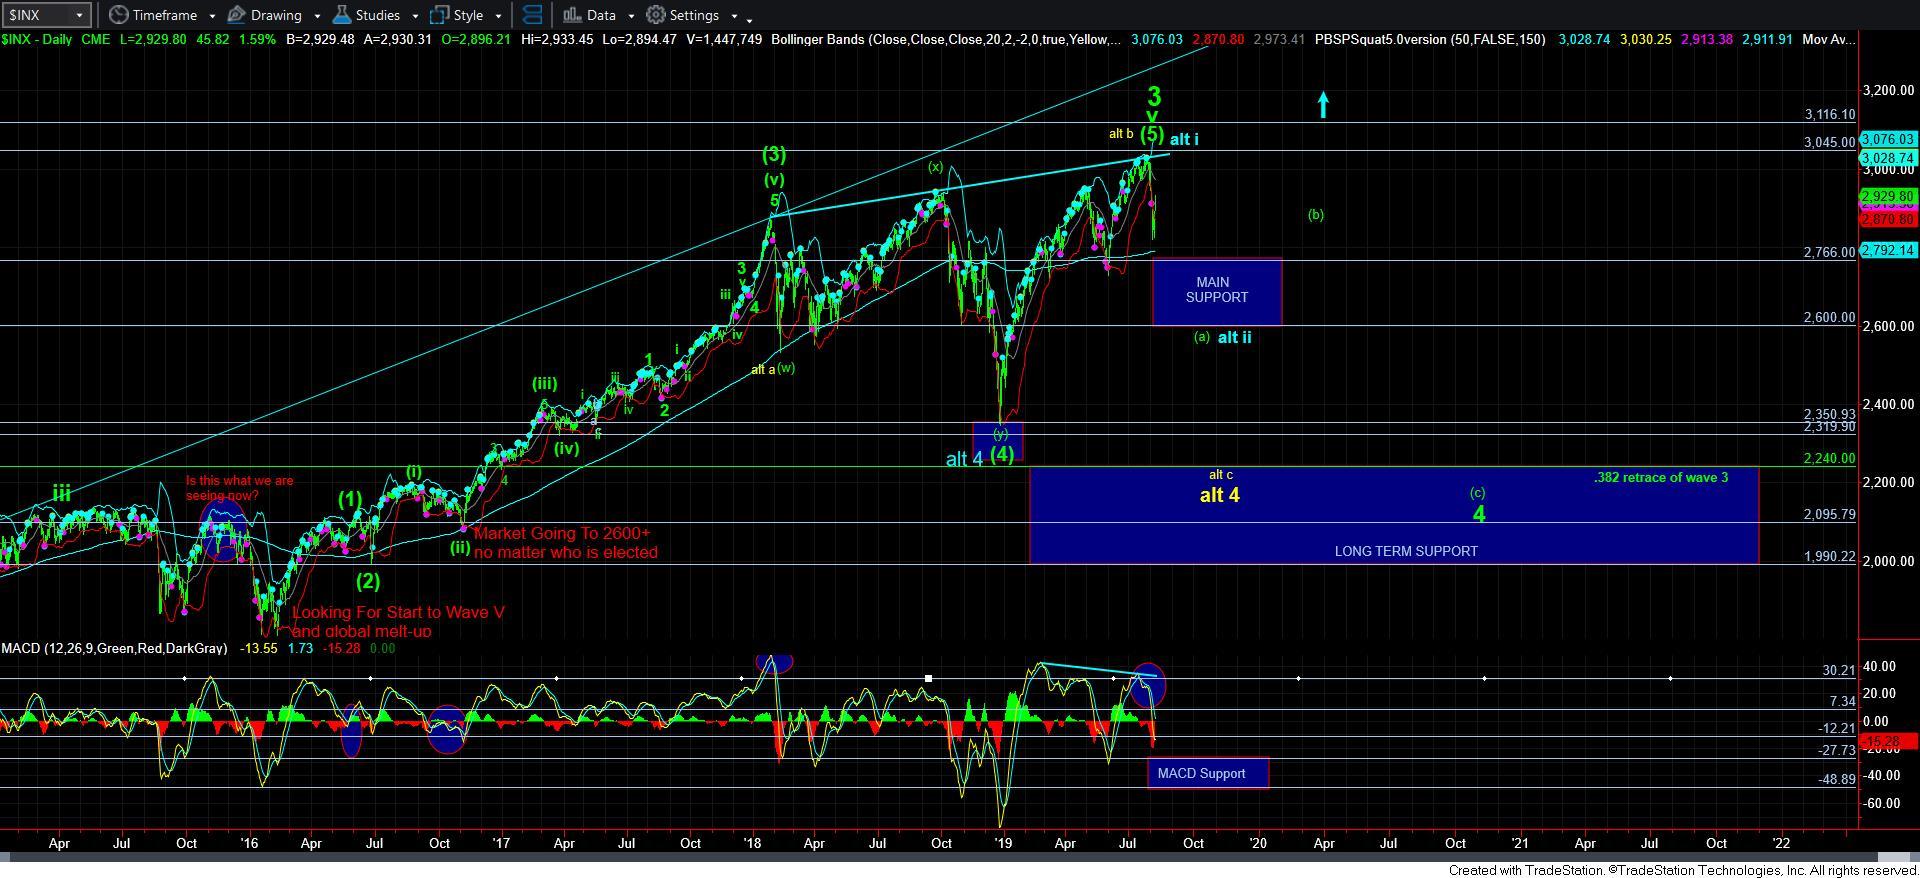
Another point I want to make is that I had to slightly adjust the upper end of the box due to the extreme extensions we had today in this wave 3. So, the upper end of resistance now resides in the 2978SPX region, which is where we would see a [c]=1.382*[a] relationship, again, assuming the low of the a-wave was struck in the overnight session earlier this week. As long as we remain below that resistance, I am targeting a larger c-wave down pointing us just below the 2700SPX region, and most likely towards the .500 retracement of the rally off the December 2018 lows.
The other matter we need to address is the yellow wave structure. To be honest, this move higher has made that quite the unlikely potential at this time. Now, clearly, if we were to see a strong direct break down below 2600SPX on the next drop, then we can assume the yellow structure is operative. But, unfortunately, I do not see that as a high probability at this time. So, while I will leave it on the chart, I want to know that I see the probability of this following through as less than 30% at this time.
Ultimately, we are now left with two main counts to track. As I have said many times before, the green count remains the primary count, which suggests we have just recently begun a long, drawn out wave 4, which can take us well into 2020. The alternative is the blue count, which could bottom after the next drop in the c-wave. Until we see how the market rallies off the bottom of the expected c-wave down, we will not have anything to suggest we need to take the blue count more seriously. Should we see a CLEAR impulsive 5-wave structure develop off the bottom of the impending c-wave decline, then I would be willing to take the blue alternative count more seriously.
For now, I think I have to look higher over the coming days as the market completes wave 3-4-5 of this [c] wave rally, as long as we are able to hold support over the 2890-2902SPX reigon.