Next 10 Points Should Tell The Story
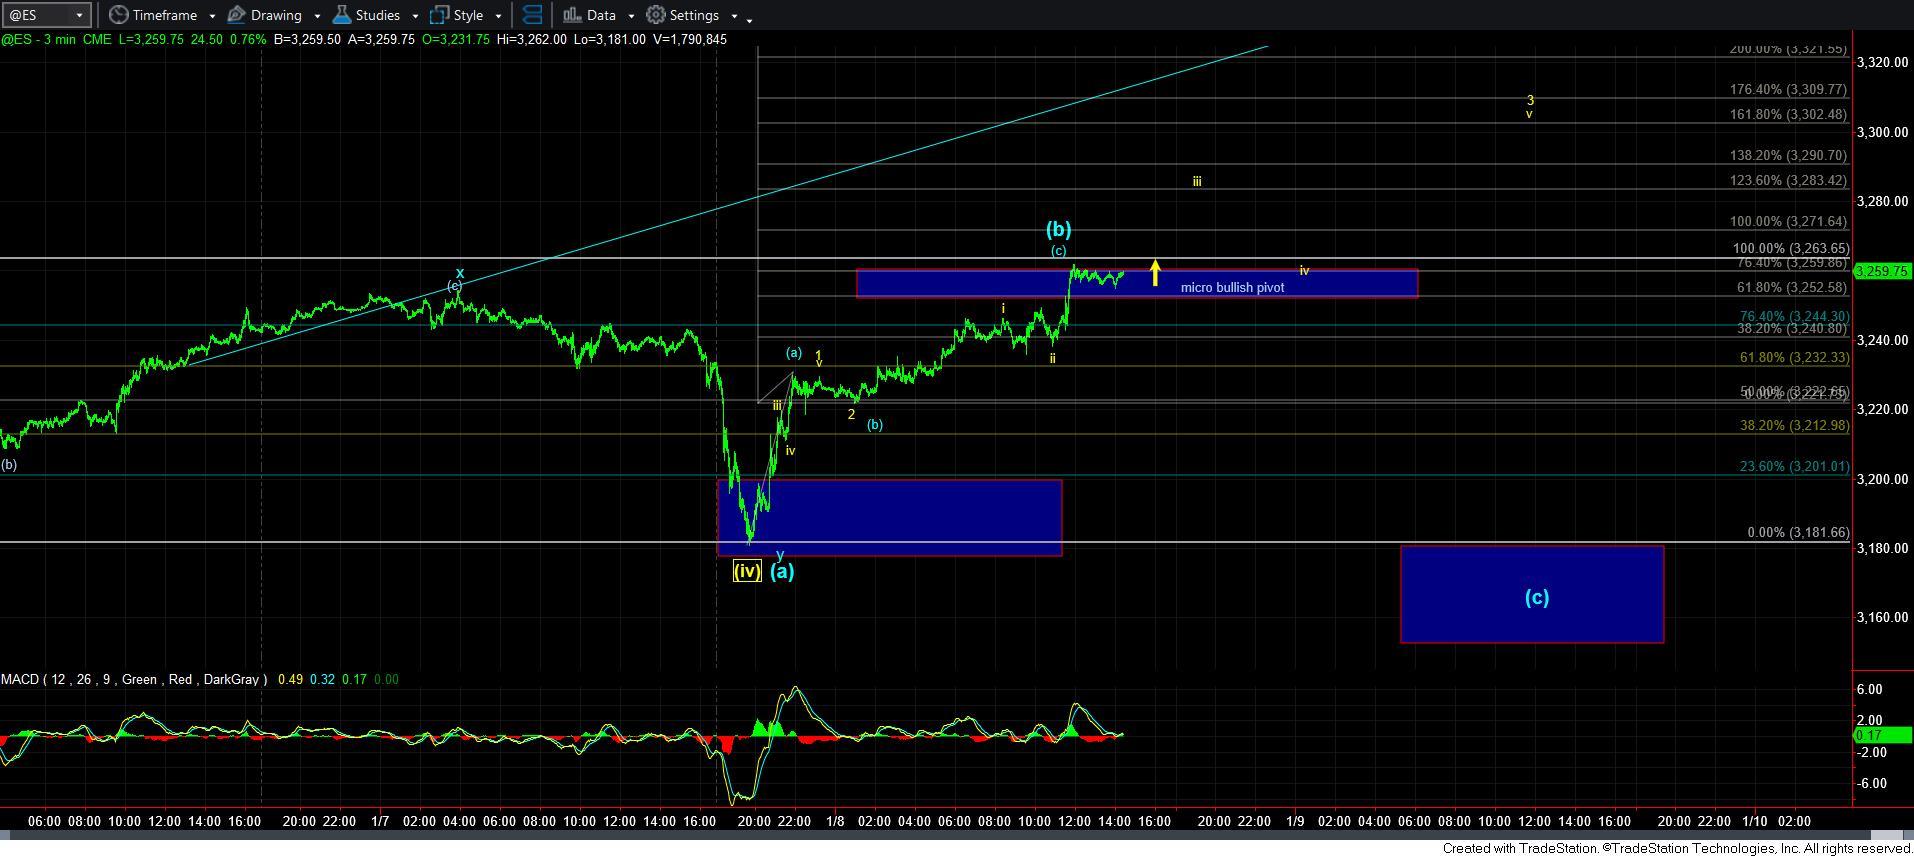
For those that were trading last night, it was quite exciting. As we came into the close, the market had a set up pointing down to the target box we had on our ES chart with a minimum expectation of just below 3200ES. And, within a few hours later, we were already there.
As we moved down to the 3185ES region, I was noting that it looked like we will likely bottom within the 3175-85ES region, as long as we held that support. Also, as I said yesterday, the nature of the rally off that low would be indicative of whether we will be following the yellow count, or the blue count. With the market providing us a 5-wave rally off the low, I highlighted that the yellow count had gained in probabilities. And, as we stand right now, the market is in its micro bullish pivot region, which if broken through, will then become support for the yellow count.
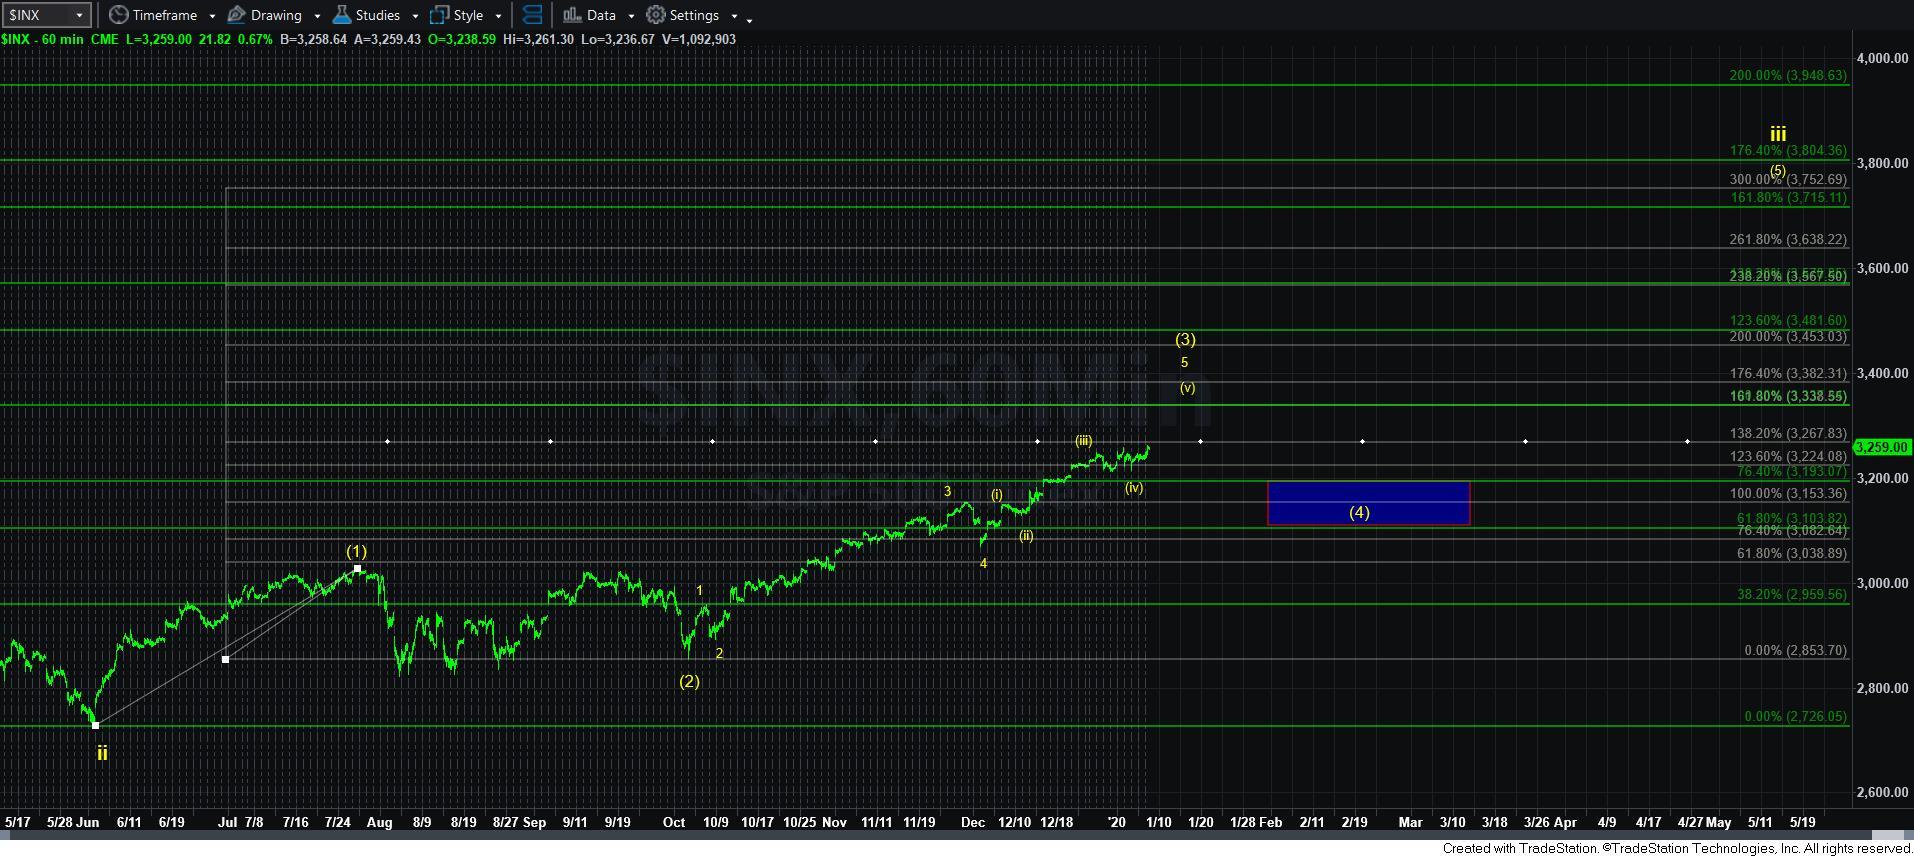
Moreover, as I noted in the live video this morning, within the yellow count, the ideal target for this move up - assuming we break out over and then hold the pivot as support – is the 3338SPX region. I noted that it was the 1.00 extension of waves i and ii within that count, and overlapped with the 1.618 extension of waves [1] and [2] within wave iii. And, that is the ideal target region for a wave [3] within wave iii within that count.
Therefore, if the current rally does take us up to that level and completes 5-waves up into that region, that would solidify the yellow count for me. That would mean I would then expect a wave [4] pullback into the box below on the 60-minute yellow count chart, which would then set us up for a 500-800 point rally for the rest of 2020.
Alternatively, if the market is unable to maintain the current yellow count break out, then it would keep me well within the blue count. But, I would still need to see a break down below 3150SPX to suggest that this is the applicable count.
For now, the market is providing strong cues for the yellow count, and should we break out through the pivot on the 3 minute ES chart, and then hold over that pivot on the wave iv pullback, we should be on our way ideally to the 3338SPX region over the coming week or two. But, again, keep in mind that will likely set us up for a sizeable wave [4] pullback as we look towards the rest of the first quarter of 2020.


