New Lows May Provide New Opportunites
Overnight the markets continued to push lower and broke the lows that were struck back in May thus invalidating the immediate bottoming count that was in play as of Friday. This new low does give us an opportunity to develop a cleaner initial pattern off of the lows once a bottom is struck as the previous start off of the May low had morphed into a three-wave pattern thus not leaving us with a clear path forward to new all-time highs. In fact, had we been left with the May low and price action into the end of next week we would likey have been looking at several months of choppy and sloppy price action that would have been very difficult to Navigate even if the market were to push to new all-time high. So while from a price perspective these new lows may not welcome news to many investors from a wave count perspective it does provide us with an opportunity to have a much clearer path forward in the months ahead. There is still of course quite a bit of work that needs to be done before any bottom is confirmed and the path to new highs can be laid out however the new low did give us a re-set to which we can once again look for a clean path forward.
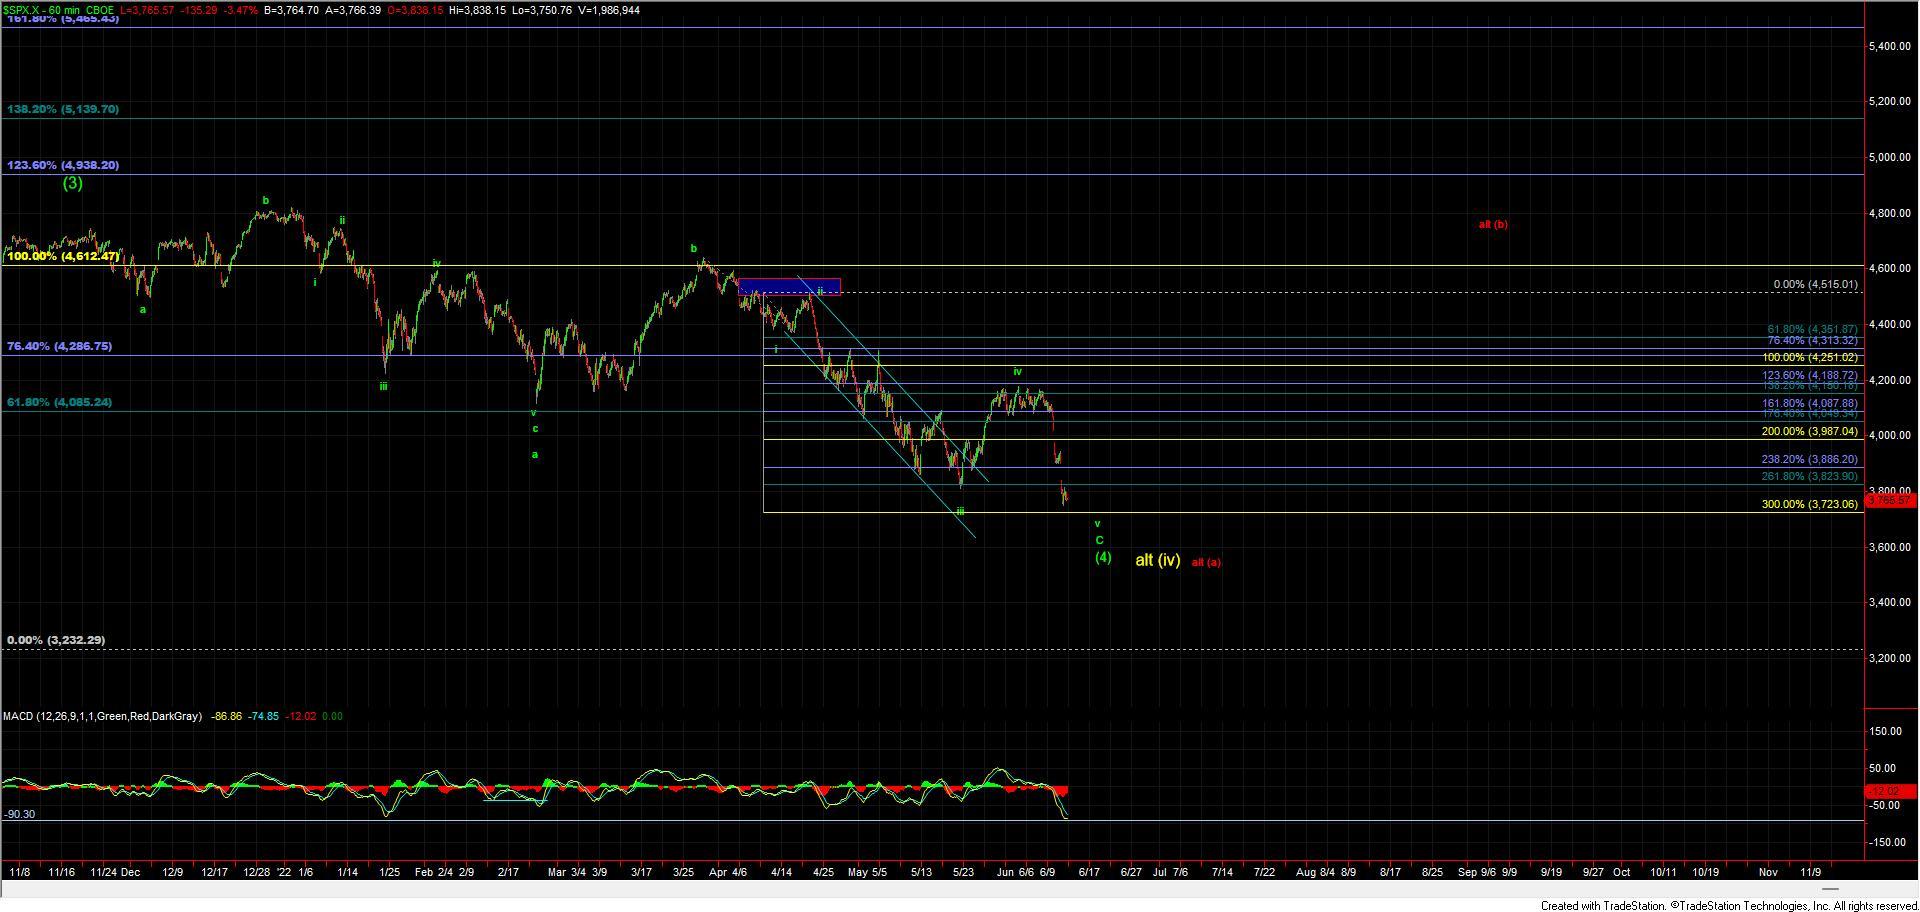
I have laid out the new path on the 60min SPX chart which shows the June high as the wave iv of larger wave C of (4). So with that, the new low would put us in the wave v of C of (4). Furthermore, due to the structure of the entire move down off of the March highs, I prefer to count this wave C as a larger non-overlapping Ending Diagonal. This is making it a little more difficult to define the downside targets with as much precision as if we were dealing with an impulsive wave pattern but it would suggest that once this wave C is completed the reveal back higher should be quite sharp and swift as this is the characteristic of the reveals of Ending Diagonal wave patterns. With that said it does, however, look as though the smaller degree pattern is not quite completed yet and with that as long as this maintains under that smaller degree resistance zone I think it is likely that we will see another lower low before that ultimate bottom is indeed struck. If we are following this pattern as laid out above however we should be fairly close to that bottom but again there is still some work to do before we can call a bottom in place.
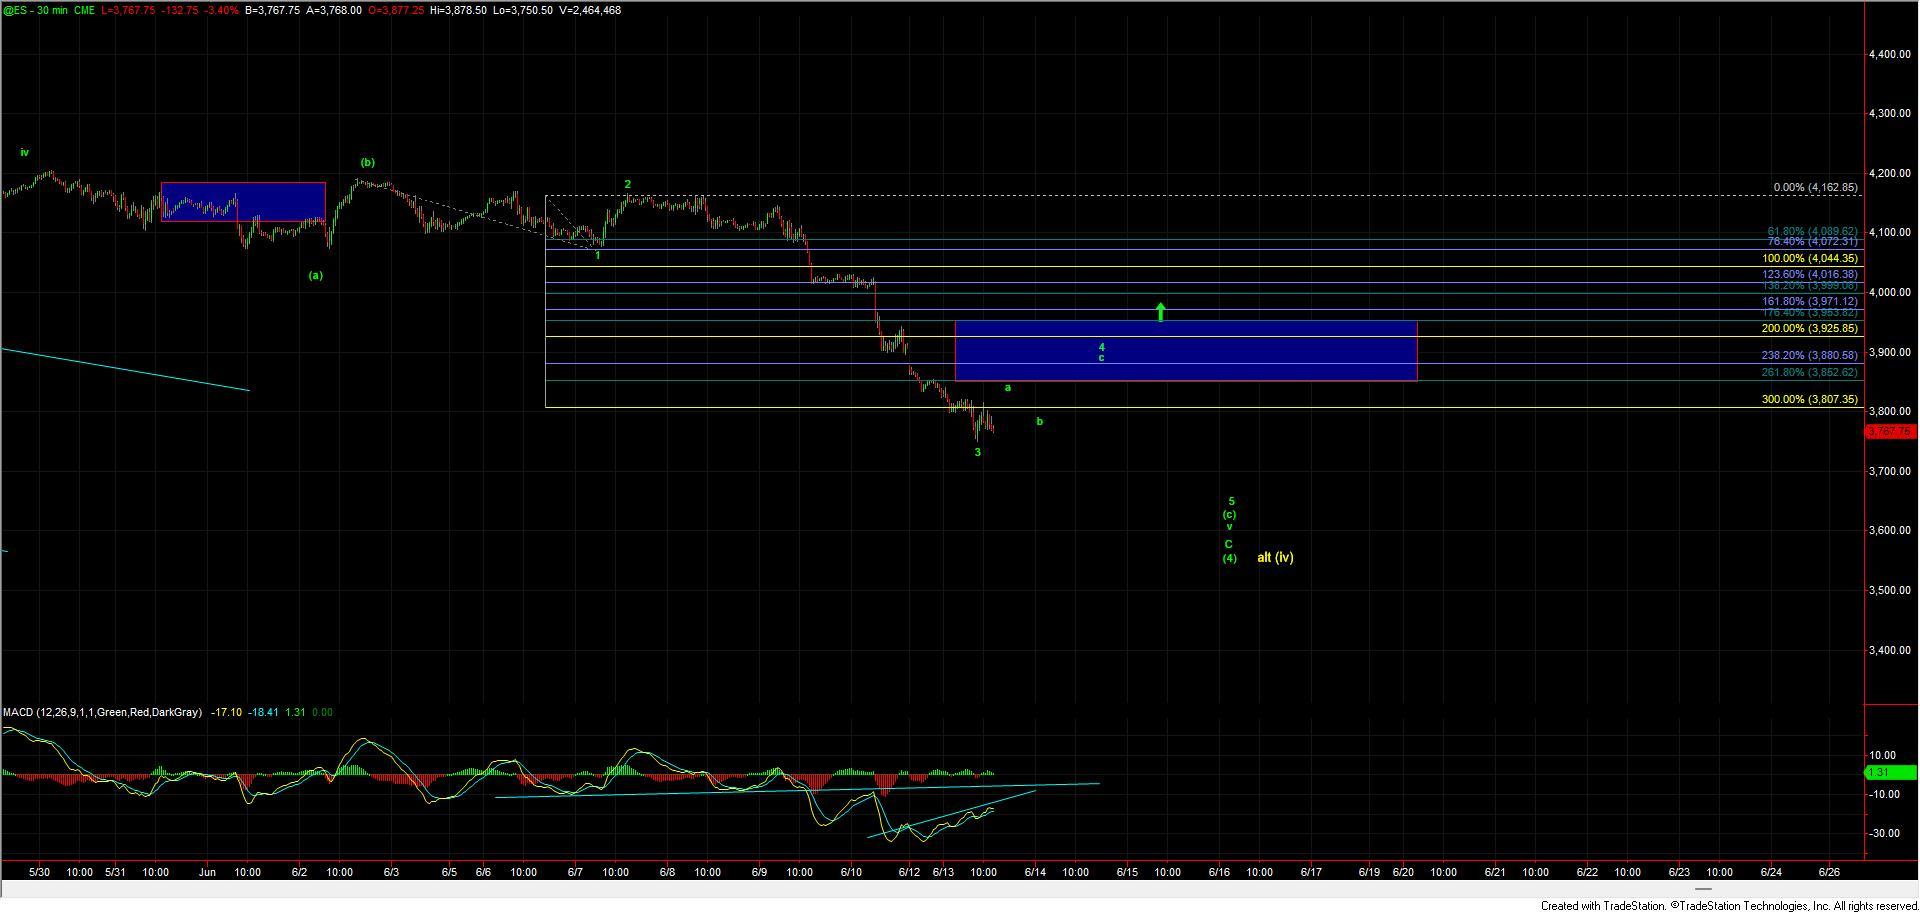
Zooming into the smaller timeframes as laid out on the ES chart I think it is reasonably probable that we have stuck a bottom in the wave 3 of (c) of v o C of (4). In simple terms what this means is that we should ideally see some consolidation / push higher in this region up towards the 3850-3950 zone before ultimately seeing another lower low to finish off the final wave v of C of (4) as noted on the SPX chart. Should we see a break back over the 3953 level then it would give us an initial signal that we may have put in a bottom however to give us a signal that we have put in a bottom in all of the wave (4) that push over that zone should come in the form of a five wave structure. If we do not see a five-wave structure off of the lows and hold under that resistance zone then we likely will see that final push lower for the wave 5 of (c) of v of C of (4) after which I would be looking for a clean five wave move up to give us an early signal of a bottom which should then see a move through the 3950 level to give further confirmation that a low is indeed in place.
So while this price action is not what most investors wanted to see it can be viewed as an opportunity to give us a reset of the count and the potential to see a much clearer path forward in the months ahead. There is however still some work that needs to be done before we can consider a bottom in place in the form of both structure and price levels, and until we see that occur caution is still certainly warranted in this region.


