Narrowing Down The Paths
 By
Avi Gilburt
When you consider that there are infinite number of paths the market can take, I have always found it quite amazing how Elliott Wave analysis can narrow that down to just two or maybe three paths. And, over the, weekend, I was considering three paths, with two ultimately pointing lower after an expected bounce. Now, with the bounce taking us beyond the resistance point I noted in the 5-minute chart over the weekend, I can narrow this down to two paths. And, I am viewing the bearish path as a bit more likely right now.
Let me expecting. The rally off the recent lows was clearly a corrective mess at the end of last week. I had a hard time viewing the futures structure and constructing a bullish structure out of it. But, I said that if we do rally early in the coming week, then maybe we can view the rally as a leading diagonal. And, while I do not view leading diagonals as strong and reliable trading cues, I would have still followed it.
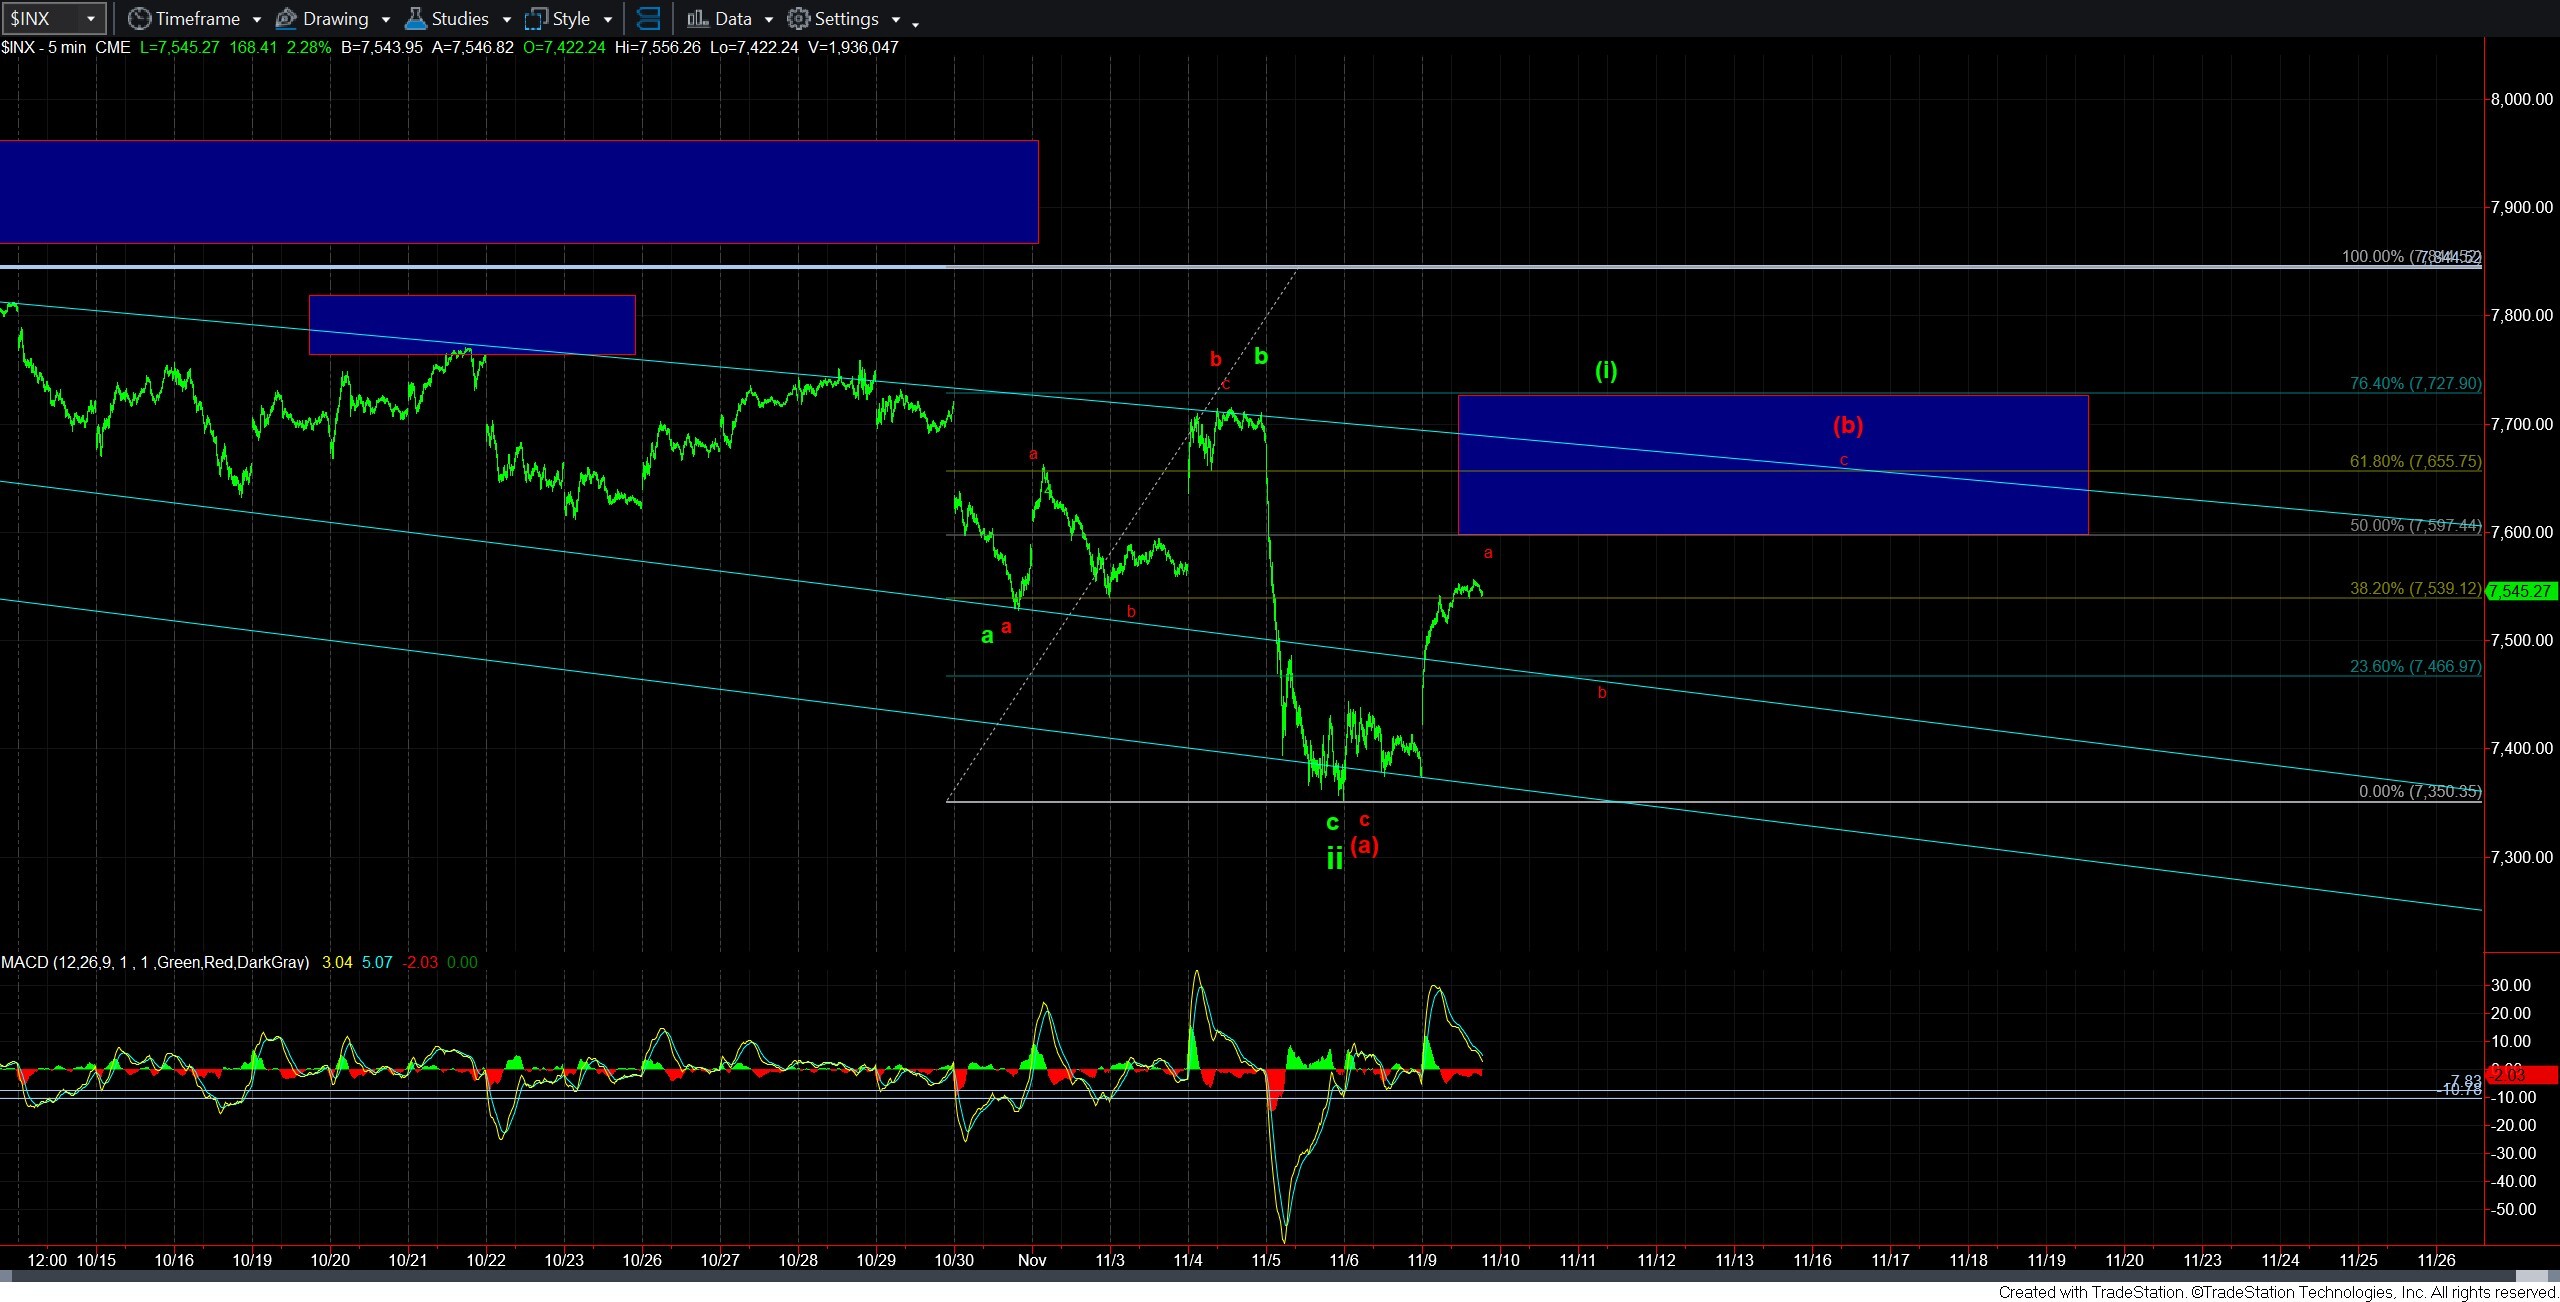
But, the rally has carried us beyond the point of any reasonable 5th wave within even a leading diagonal. This makes me view this rally primarily as a corrective one. And, the primary count I am attaching to this rally is an a-wave within a bigger (b) wave rally. Of course, this could be all of the (b) wave rally, but I think it to be relatively small as compared to the (a) wave decline, and it is also more shallow than we would normally see for a (b) wave retracement. So, that is why I have noted the a-wave labeling.
Moreover, the a-wave within a (b) wave structure often targets the .382 retracement of the prior decline, and sometimes it even carries up to the .500 retracement. As of my writing this update, we have slightly exceeded the .382 retracement, as you can see on the attached 5-minute SPX chart. So, it really does count well as a potential a-wave within the (b) wave rally.
This now provides me with an expectation of a b-wave pullback, which should set up a rally to the target/resistance box for the (b) wave.
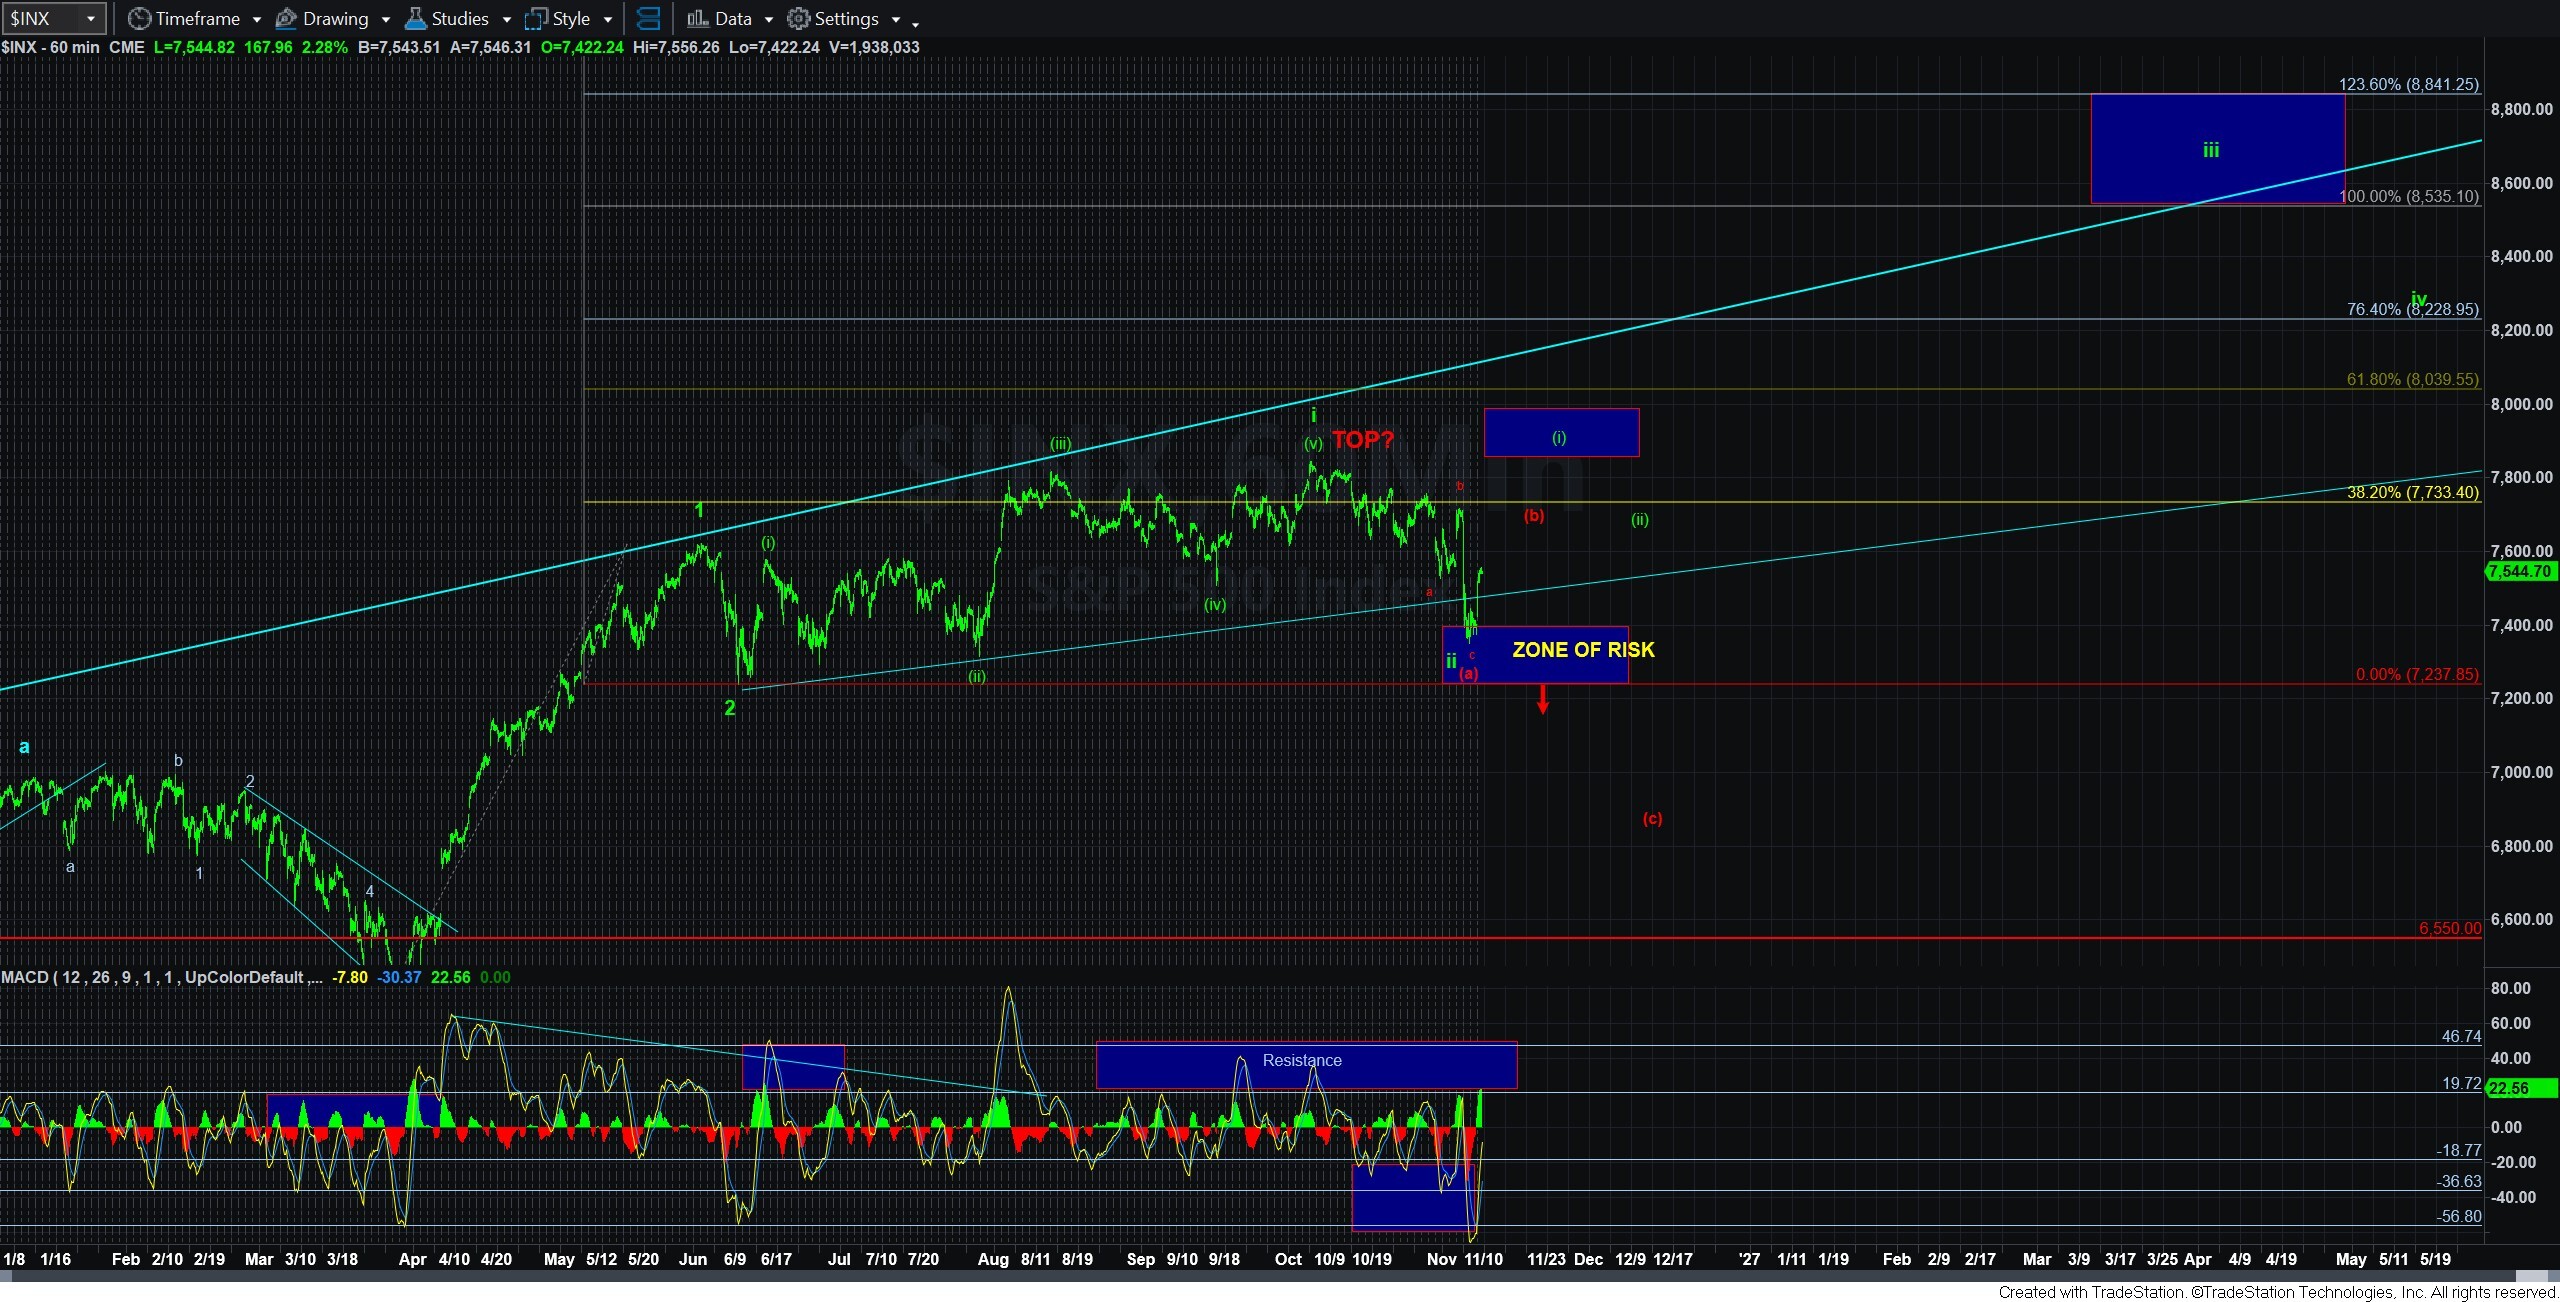
Of course, should we see the market decline in a 5-wave structure then we would have to consider this to be a very shallow and relatively small (b) wave already. But, my expectation is for a more “normal” (b) wave structure, as that will also allow the 60-minute MACD to reset back to the resistance zone overhead.
Alternatively, I am still leaving the green count on the chart for now. While I simply do not have a reliable path to provide to you for this path right now, I am going to maintain an open mind, since we have not broken down below the 7237SPX just yet. So, this still remains a reasonable count, but I do not see it as a highly likely at this time due to the depth of the pullback (below the .764 retracement) and the corrective manner in which we began the rally off the low.
So, in my primary analysis, I am seeing pressure as being to the downside as long as the resistance box on the 5-minute SPX chart is respected.